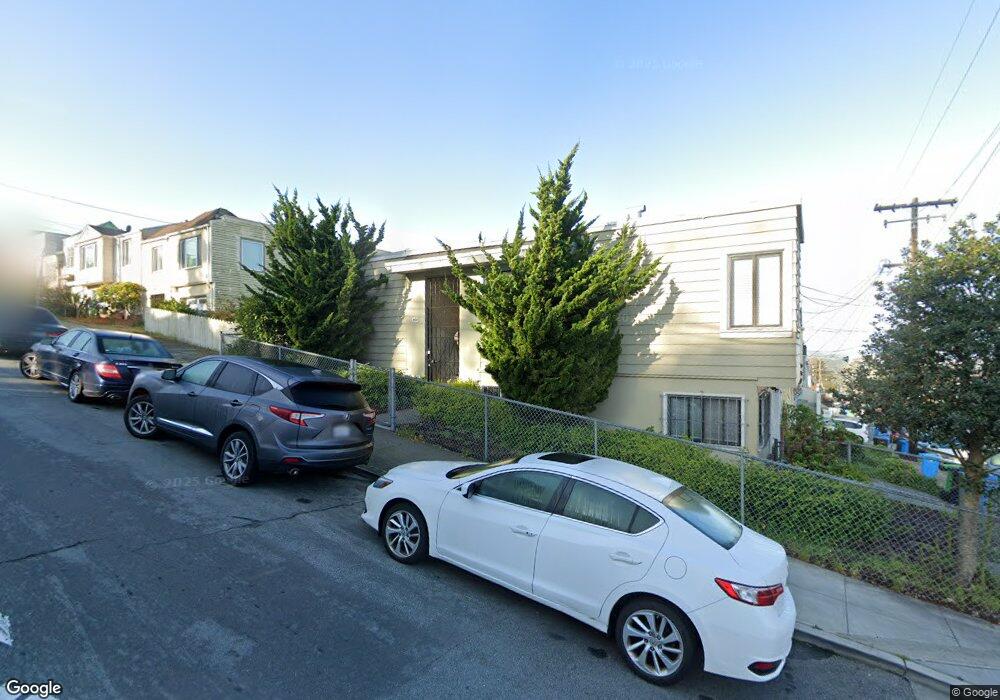
295 Byxbee St San Francisco, CA 94132
Merced Heights NeighborhoodEstimated Value: $1,296,000 - $1,586,000
4
Beds
3
Baths
1,840
Sq Ft
$776/Sq Ft
Est. Value
About This Home
This home is located at 295 Byxbee St, San Francisco, CA 94132 and is currently estimated at $1,428,325, approximately $776 per square foot. 295 Byxbee St is a home located in San Francisco County with nearby schools including Ortega (Jose) Elementary School, Aptos Middle School, and Stratford School.
Ownership History
Date
Name
Owned For
Owner Type
Purchase Details
Closed on
Aug 24, 2009
Sold by
Lao Ricky and Chen Christina W
Bought by
Liu Wei and Li Hong
Current Estimated Value
Home Financials for this Owner
Home Financials are based on the most recent Mortgage that was taken out on this home.
Original Mortgage
$430,000
Interest Rate
5.12%
Mortgage Type
Adjustable Rate Mortgage/ARM
Purchase Details
Closed on
Jun 3, 2008
Sold by
Sullivan Cinda
Bought by
Lao Ricky J and Chen Christina W
Home Financials for this Owner
Home Financials are based on the most recent Mortgage that was taken out on this home.
Original Mortgage
$417,000
Interest Rate
6.05%
Mortgage Type
Purchase Money Mortgage
Purchase Details
Closed on
Dec 28, 2006
Sold by
Sullivan Cinda
Bought by
Sullivan Cinda
Purchase Details
Closed on
Mar 20, 1997
Sold by
Jackson James D and Jackson Pauline E
Bought by
Jackson James D and Jackson Pauline E
Create a Home Valuation Report for This Property
The Home Valuation Report is an in-depth analysis detailing your home's value as well as a comparison with similar homes in the area
Home Values in the Area
Average Home Value in this Area
Purchase History
| Date | Buyer | Sale Price | Title Company |
|---|---|---|---|
| Liu Wei | $890,000 | Old Republic Title Company | |
| Lao Ricky J | -- | None Available | |
| Lao Ricky J | $612,000 | Fidelity National Title Co | |
| Sullivan Cinda | -- | None Available | |
| Jackson James D | -- | -- | |
| Jackson James D | -- | -- |
Source: Public Records
Mortgage History
| Date | Status | Borrower | Loan Amount |
|---|---|---|---|
| Previous Owner | Liu Wei | $430,000 | |
| Previous Owner | Lao Ricky J | $417,000 |
Source: Public Records
Tax History Compared to Growth
Tax History
| Year | Tax Paid | Tax Assessment Tax Assessment Total Assessment is a certain percentage of the fair market value that is determined by local assessors to be the total taxable value of land and additions on the property. | Land | Improvement |
|---|---|---|---|---|
| 2025 | $12,395 | $1,069,637 | $748,749 | $320,888 |
| 2024 | $12,395 | $1,048,665 | $734,068 | $314,597 |
| 2023 | $12,219 | $1,028,104 | $719,675 | $308,429 |
| 2022 | $12,002 | $1,007,946 | $705,564 | $302,382 |
| 2021 | $11,796 | $988,183 | $691,730 | $296,453 |
| 2020 | $12,512 | $978,052 | $684,638 | $293,414 |
| 2019 | $12,036 | $958,875 | $671,214 | $287,661 |
| 2018 | $11,632 | $940,074 | $658,053 | $282,021 |
| 2017 | $11,196 | $921,642 | $645,150 | $276,492 |
| 2016 | $11,007 | $903,571 | $632,500 | $271,071 |
| 2015 | $10,870 | $890,000 | $623,000 | $267,000 |
| 2014 | $9,336 | $766,267 | $459,031 | $307,236 |
Source: Public Records
Map
Nearby Homes
- 131 Beverly St
- 621 Shields St
- 230 Ralston St
- 531 Arch St
- 424 Garfield St
- 532 Ramsell St
- 119 Vernon St
- 118 Summit Way
- 233 Sargent St
- 73 Summit Way
- 475 Head St
- 442 Bright St
- 20 Sargent St
- 150 Chester Ave
- 114 Saint Charles Ave
- 274 Montana St
- 8100 Oceanview Terrace Unit 112
- 337 Jules Ave
- 2 Westgate Dr
- 914 Capitol Ave
- 809 Garfield St
- 815 Garfield St
- 279 Byxbee St
- 819 Garfield St
- 751 Garfield St
- 275 Byxbee St
- 827 Garfield St
- 745 Garfield St
- 271 Byxbee St
- 833 Garfield St
- 739 Garfield St
- 280 Byxbee St
- 267 Byxbee St
- 278 Monticello St
- 274 Byxbee St
- 839 Garfield St
- 301 Byxbee St
- 806 Garfield St
- 274 Monticello St
- 733 Garfield St