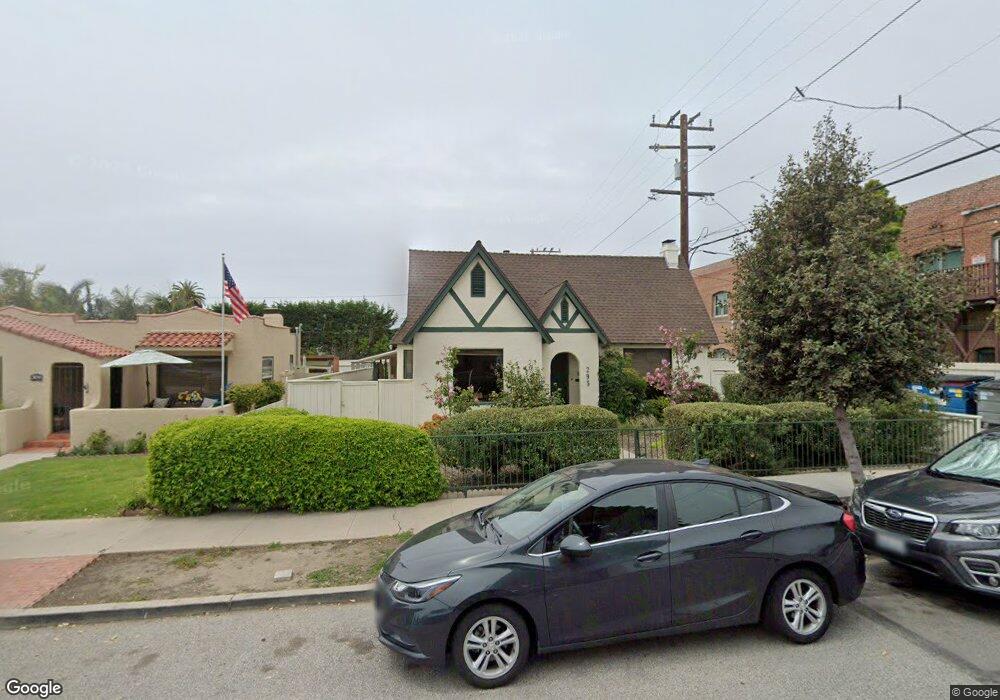
295 San Clemente St Ventura, CA 93001
Midtown NeighborhoodEstimated Value: $858,000 - $1,109,000
3
Beds
2
Baths
1,487
Sq Ft
$687/Sq Ft
Est. Value
About This Home
This home is located at 295 San Clemente St, Ventura, CA 93001 and is currently estimated at $1,020,913, approximately $686 per square foot. 295 San Clemente St is a home located in Ventura County with nearby schools including Lincoln Elementary School, Cabrillo Middle School, and Ventura High School.
Ownership History
Date
Name
Owned For
Owner Type
Purchase Details
Closed on
Dec 4, 2009
Sold by
Mcmillin Russell Bodine
Bought by
Mcmillin Russell B
Current Estimated Value
Purchase Details
Closed on
Mar 20, 2001
Sold by
Mcmillin Russell Bodine and Mcmillin Cheryl Golden Bear
Bought by
Mcmillin Russell Bodine
Purchase Details
Closed on
Dec 19, 1996
Sold by
Navo Robert Louis
Bought by
Miller Karen A
Home Financials for this Owner
Home Financials are based on the most recent Mortgage that was taken out on this home.
Original Mortgage
$132,900
Interest Rate
7.74%
Purchase Details
Closed on
Nov 26, 1996
Sold by
Miller Karen A
Bought by
Mcmillin Russell Bodine and Mcmillin Cheryl Golden Bear
Home Financials for this Owner
Home Financials are based on the most recent Mortgage that was taken out on this home.
Original Mortgage
$132,900
Interest Rate
7.74%
Create a Home Valuation Report for This Property
The Home Valuation Report is an in-depth analysis detailing your home's value as well as a comparison with similar homes in the area
Home Values in the Area
Average Home Value in this Area
Purchase History
| Date | Buyer | Sale Price | Title Company |
|---|---|---|---|
| Mcmillin Russell B | -- | None Available | |
| Mcmillin Russell Bodine | -- | -- | |
| Miller Karen A | -- | Old Republic Title Company | |
| Mcmillin Russell Bodine | $190,000 | Old Republic Title Company |
Source: Public Records
Mortgage History
| Date | Status | Borrower | Loan Amount |
|---|---|---|---|
| Previous Owner | Mcmillin Russell Bodine | $132,900 |
Source: Public Records
Tax History Compared to Growth
Tax History
| Year | Tax Paid | Tax Assessment Tax Assessment Total Assessment is a certain percentage of the fair market value that is determined by local assessors to be the total taxable value of land and additions on the property. | Land | Improvement |
|---|---|---|---|---|
| 2025 | $3,338 | $309,252 | $162,854 | $146,398 |
| 2024 | $3,338 | $303,189 | $159,661 | $143,528 |
| 2023 | $3,297 | $297,245 | $156,531 | $140,714 |
| 2022 | $3,073 | $291,417 | $153,462 | $137,955 |
| 2021 | $3,014 | $285,703 | $150,453 | $135,250 |
| 2020 | $2,985 | $282,775 | $148,911 | $133,864 |
| 2019 | $2,929 | $277,232 | $145,992 | $131,240 |
| 2018 | $2,880 | $271,797 | $143,130 | $128,667 |
| 2017 | $2,819 | $266,469 | $140,324 | $126,145 |
| 2016 | $2,764 | $261,245 | $137,573 | $123,672 |
| 2015 | $2,734 | $257,322 | $135,507 | $121,815 |
| 2014 | $2,689 | $252,283 | $132,853 | $119,430 |
Source: Public Records
Map
Nearby Homes
- 1901 Ocean Ave
- 205 Jordan Ave
- 1907 Ocean Ave
- 44 Coronado St Unit 202
- 66 San Clemente St
- Plan D at Portalvo - Townhomes
- Plan F at Portalvo - Townhomes
- Plan E at Portalvo - Townhomes
- Plan O at Portalvo - Condos/Flats
- Plan A at Portalvo - Townhomes
- Plan H at Portalvo - Condos/Flats
- Plan L at Portalvo - Condos/Flats
- Plan C at Portalvo - Townhomes
- Plan B at Portalvo - Townhomes
- Plan J at Portalvo - Condos/Flats
- Plan G at Portalvo - Townhomes
- Plan N at Portalvo - Condos/Flats
- Plan K at Portalvo - Condos/Flats
- Plan M at Portalvo - Condos/Flats
- 1884 Channel Dr
- 309 San Clemente St
- 325 San Clemente St
- 2110 E Thompson Blvd
- 294 S Catalina St
- 308 S Catalina St
- 341 San Clemente St
- 324 S Catalina St
- 294 San Clemente St
- 308 San Clemente St
- 340 S Catalina St
- 359 San Clemente St
- 324 San Clemente St
- 340 San Clemente St
- 356 S Catalina St
- 377 San Clemente St
- 358 San Clemente St
- 374 S Catalina St
- 2111 E Thompson Blvd
- 376 San Clemente St
- 393 San Clemente St