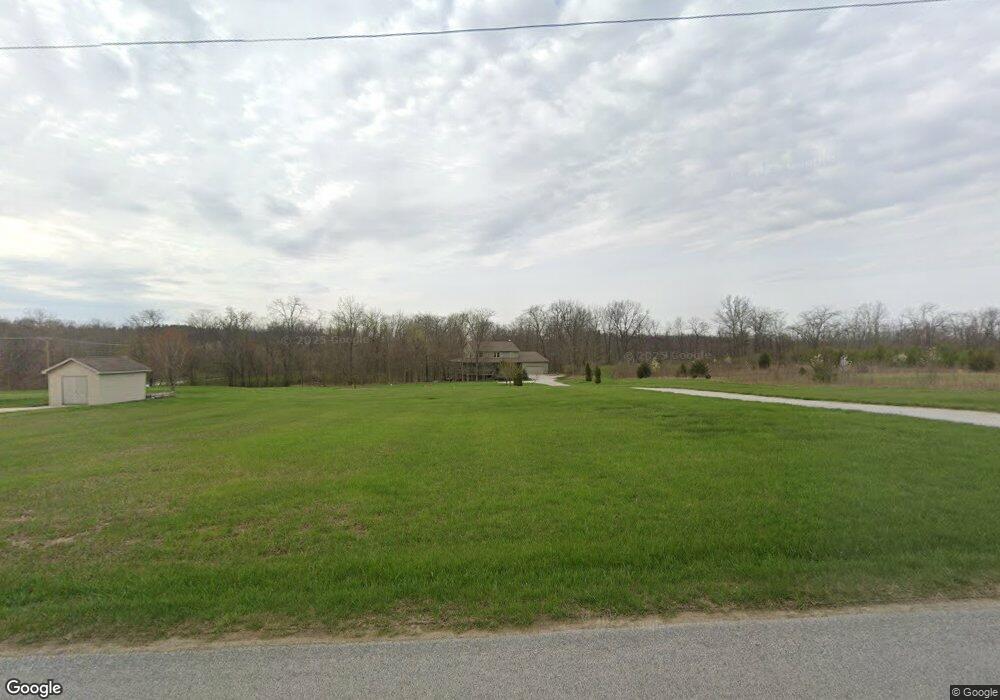
2956 E 450 N Marion, IN 46952
Estimated Value: $401,000 - $473,527
3
Beds
4
Baths
2,400
Sq Ft
$181/Sq Ft
Est. Value
About This Home
This home is located at 2956 E 450 N, Marion, IN 46952 and is currently estimated at $434,509, approximately $181 per square foot. 2956 E 450 N is a home located in Grant County.
Ownership History
Date
Name
Owned For
Owner Type
Purchase Details
Closed on
Mar 29, 2006
Sold by
Jones Michael R and Jones Randi L
Bought by
Jones Oglen A and Jones Janice L
Current Estimated Value
Home Financials for this Owner
Home Financials are based on the most recent Mortgage that was taken out on this home.
Original Mortgage
$100,000
Interest Rate
6.54%
Mortgage Type
New Conventional
Purchase Details
Closed on
Mar 31, 2005
Sold by
Jones Michael R
Bought by
Jones Michael R and Jones Randi L
Home Financials for this Owner
Home Financials are based on the most recent Mortgage that was taken out on this home.
Original Mortgage
$178,880
Interest Rate
5.71%
Mortgage Type
New Conventional
Create a Home Valuation Report for This Property
The Home Valuation Report is an in-depth analysis detailing your home's value as well as a comparison with similar homes in the area
Purchase History
| Date | Buyer | Sale Price | Title Company |
|---|---|---|---|
| Jones Oglen A | -- | None Available | |
| Jones Michael R | -- | None Available |
Source: Public Records
Mortgage History
| Date | Status | Borrower | Loan Amount |
|---|---|---|---|
| Closed | Jones Oglen A | $100,000 | |
| Closed | Jones Michael R | $178,880 |
Source: Public Records
Tax History
| Year | Tax Paid | Tax Assessment Tax Assessment Total Assessment is a certain percentage of the fair market value that is determined by local assessors to be the total taxable value of land and additions on the property. | Land | Improvement |
|---|---|---|---|---|
| 2025 | $2,336 | $329,800 | $35,200 | $294,600 |
| 2024 | $2,336 | $352,700 | $35,200 | $317,500 |
| 2023 | $2,150 | $332,600 | $35,200 | $297,400 |
| 2022 | $2,281 | $309,500 | $28,700 | $280,800 |
| 2021 | $1,972 | $267,500 | $28,700 | $238,800 |
| 2020 | $1,761 | $259,000 | $28,700 | $230,300 |
| 2019 | $1,539 | $242,500 | $28,700 | $213,800 |
| 2018 | $1,337 | $229,500 | $28,700 | $200,800 |
| 2017 | $1,159 | $214,800 | $28,700 | $186,100 |
| 2016 | $1,078 | $216,900 | $28,700 | $188,200 |
| 2014 | $1,040 | $219,100 | $28,900 | $190,200 |
| 2013 | $1,040 | $220,600 | $28,900 | $191,700 |
Source: Public Records
Map
Nearby Homes
- 4988 N Huntington Rd
- 933 E Bocock Rd
- 3220 N Huntington Rd
- 3105 N Huntington Rd
- 2325 N Huntington Rd
- 2220 N Huntington Rd
- 4015 N 600 E
- 703 E Bond Ave
- 224 E Christy St
- 528 E Wiley St
- 1845 W Westholme Dr
- 1700 E Bradford Pike
- 1502 N Baldwin Ave
- 240 Pinkerton Ct
- 932 N Washington St
- 410 N Vickery Ln
- 5804 Red Fox Dr
- 508 W Wharton Dr
- 4420 E 100 N
- 1461 N Manor Dr
Your Personal Tour Guide
Ask me questions while you tour the home.