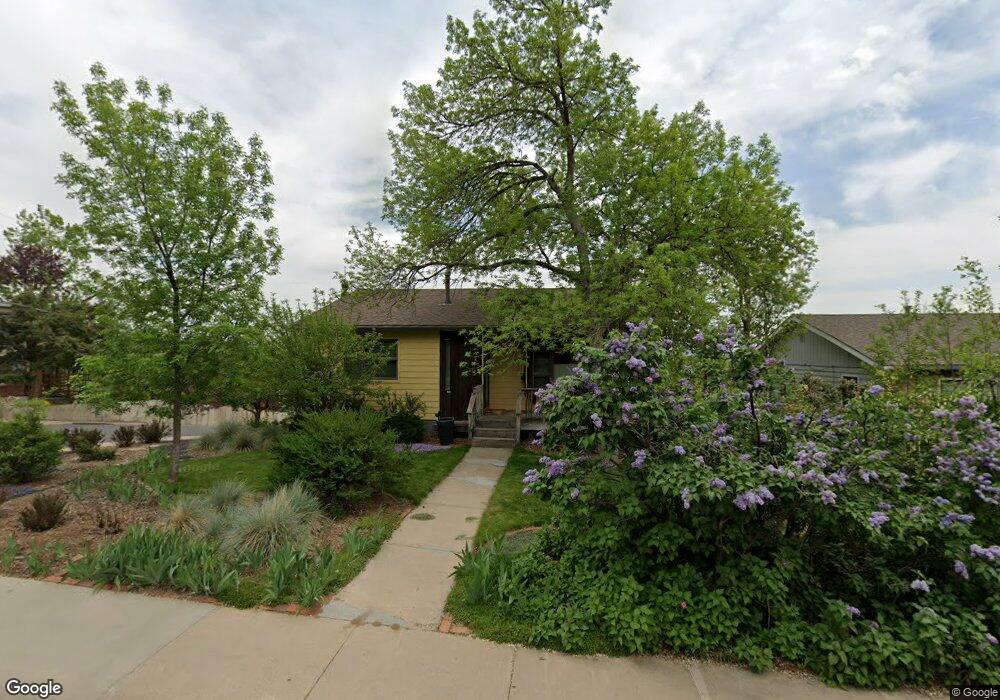
2962 4th St Boulder, CO 80304
Newlands NeighborhoodEstimated Value: $1,252,311 - $1,581,000
3
Beds
2
Baths
1,051
Sq Ft
$1,376/Sq Ft
Est. Value
About This Home
This home is located at 2962 4th St, Boulder, CO 80304 and is currently estimated at $1,446,328, approximately $1,376 per square foot. 2962 4th St is a home located in Boulder County with nearby schools including Foothill Elementary School, Casey Middle School, and Boulder High School.
Ownership History
Date
Name
Owned For
Owner Type
Purchase Details
Closed on
Jun 19, 2014
Sold by
Kranzberg Bruce
Bought by
Kranzberg Bruce
Current Estimated Value
Purchase Details
Closed on
Oct 25, 1993
Sold by
Kranzberg Bruce and Kranzberg Cary S
Bought by
Kranzberg Bruce
Purchase Details
Closed on
Aug 29, 1986
Bought by
Bruce Kranzberg and Sacco Cathy
Purchase Details
Closed on
Dec 23, 1983
Bought by
Bruce Kranzberg and Sacco Cathy
Purchase Details
Closed on
May 4, 1977
Bought by
Bruce Kranzberg and Sacco Cathy
Create a Home Valuation Report for This Property
The Home Valuation Report is an in-depth analysis detailing your home's value as well as a comparison with similar homes in the area
Home Values in the Area
Average Home Value in this Area
Purchase History
| Date | Buyer | Sale Price | Title Company |
|---|---|---|---|
| Kranzberg Bruce | -- | None Available | |
| Kranzberg Bruce | -- | -- | |
| Bruce Kranzberg | -- | -- | |
| Bruce Kranzberg | $99,500 | -- | |
| Bruce Kranzberg | $51,300 | -- |
Source: Public Records
Tax History
| Year | Tax Paid | Tax Assessment Tax Assessment Total Assessment is a certain percentage of the fair market value that is determined by local assessors to be the total taxable value of land and additions on the property. | Land | Improvement |
|---|---|---|---|---|
| 2025 | $8,589 | $95,538 | $85,984 | $9,554 |
| 2024 | $8,589 | $95,538 | $85,984 | $9,554 |
| 2023 | $8,440 | $104,433 | $97,306 | $10,812 |
| 2022 | $6,837 | $80,578 | $71,745 | $8,833 |
| 2021 | $6,520 | $82,897 | $73,809 | $9,088 |
| 2020 | $5,873 | $74,618 | $59,703 | $14,915 |
| 2019 | $6,396 | $74,618 | $59,703 | $14,915 |
| 2018 | $5,672 | $65,426 | $52,344 | $13,082 |
| 2017 | $5,495 | $72,332 | $57,869 | $14,463 |
| 2016 | $5,133 | $59,302 | $43,541 | $15,761 |
| 2015 | $4,861 | $52,631 | $22,845 | $29,786 |
| 2014 | $4,425 | $52,631 | $22,845 | $29,786 |
Source: Public Records
Map
Nearby Homes
- 3015 3rd St
- 3033 3rd St
- 2958 6th St
- 3080 7th St
- 515 Alpine Ave
- 3189 5th St
- 3056 8th St
- 2675 Dakota Place Unit Newlands
- 405 Valley View Dr
- 815 Alpine Ave Unit 2
- 534 Dewey Ave
- 2586 3rd St
- 653 Dewey Ave
- 2815 11th St
- 503 Hawthorn Ave
- 625 Concord Ave
- 865 Grape Ave Unit X
- 3025 Broadway St Unit 7
- 560 Iris Ave
- 711 Hawthorn Ave