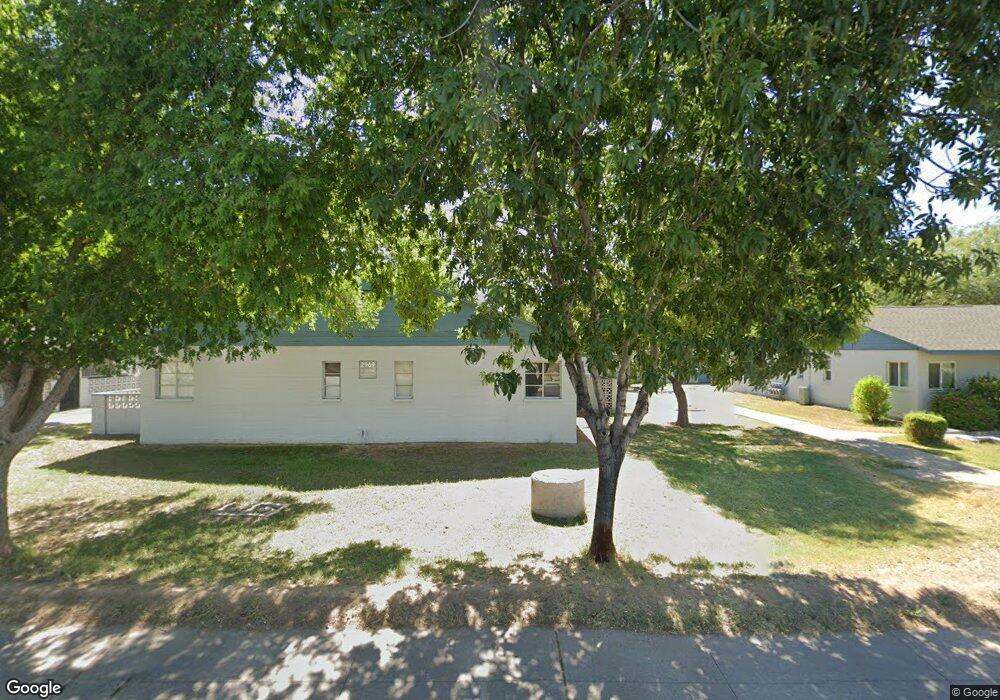
2969 N 19th Ave Unit 46 Phoenix, AZ 85015
North Encanto NeighborhoodEstimated Value: $151,000 - $299,000
--
Bed
1
Bath
648
Sq Ft
$298/Sq Ft
Est. Value
About This Home
This home is located at 2969 N 19th Ave Unit 46, Phoenix, AZ 85015 and is currently estimated at $193,086, approximately $297 per square foot. 2969 N 19th Ave Unit 46 is a home located in Maricopa County with nearby schools including Encanto Elementary School, Clarendon Elementary School, and Osborn Middle School.
Ownership History
Date
Name
Owned For
Owner Type
Purchase Details
Closed on
Dec 7, 2005
Sold by
Mahmic Edin and Stanek Mahmic Izabela
Bought by
Armijo Charles
Current Estimated Value
Home Financials for this Owner
Home Financials are based on the most recent Mortgage that was taken out on this home.
Original Mortgage
$63,900
Outstanding Balance
$35,433
Interest Rate
6.14%
Mortgage Type
New Conventional
Estimated Equity
$157,653
Purchase Details
Closed on
Jul 14, 1998
Sold by
Sossomen Arthur and Sossomen Arthur L
Bought by
Mahmic Edin and Stanek Mahmic Izabela
Purchase Details
Closed on
Feb 26, 1996
Sold by
Nikich Julie R and Velimirovich Milica
Bought by
Sossomen Arthur L
Home Financials for this Owner
Home Financials are based on the most recent Mortgage that was taken out on this home.
Original Mortgage
$13,600
Interest Rate
6.98%
Mortgage Type
New Conventional
Create a Home Valuation Report for This Property
The Home Valuation Report is an in-depth analysis detailing your home's value as well as a comparison with similar homes in the area
Home Values in the Area
Average Home Value in this Area
Purchase History
| Date | Buyer | Sale Price | Title Company |
|---|---|---|---|
| Armijo Charles | $63,900 | First Southwestern Title Age | |
| Mahmic Edin | -- | First Southwestern Title | |
| Sossomen Arthur L | $18,000 | United Title Agency |
Source: Public Records
Mortgage History
| Date | Status | Borrower | Loan Amount |
|---|---|---|---|
| Open | Armijo Charles | $63,900 | |
| Previous Owner | Sossomen Arthur L | $13,600 |
Source: Public Records
Tax History Compared to Growth
Tax History
| Year | Tax Paid | Tax Assessment Tax Assessment Total Assessment is a certain percentage of the fair market value that is determined by local assessors to be the total taxable value of land and additions on the property. | Land | Improvement |
|---|---|---|---|---|
| 2025 | $269 | $2,352 | -- | -- |
| 2024 | $250 | $2,240 | -- | -- |
| 2023 | $250 | $11,660 | $2,330 | $9,330 |
| 2022 | $249 | $8,170 | $1,630 | $6,540 |
| 2021 | $256 | $6,480 | $1,290 | $5,190 |
| 2020 | $249 | $6,120 | $1,220 | $4,900 |
| 2019 | $237 | $5,130 | $1,020 | $4,110 |
| 2018 | $229 | $3,350 | $670 | $2,680 |
| 2017 | $208 | $2,860 | $570 | $2,290 |
| 2016 | $200 | $2,310 | $460 | $1,850 |
| 2015 | $187 | $2,350 | $470 | $1,880 |
Source: Public Records
Map
Nearby Homes
- 2985 N 19th Ave Unit 11
- 1813 W Earll Dr
- 2945 N 19th Ave Unit 67
- 2941 N 19th Ave Unit 95
- 1728 W Avalon Dr
- 2917 N 19th Ave Unit 128
- 2917 N 19th Ave Unit 114
- 1721 W Earll Dr
- 3001 N 17th Dr
- 3327 N 18th Ave
- 2017 W Edgemont Ave
- 1735 W Mitchell Dr
- 2124 W Pinchot Ave
- 2011 W Cambridge Ave
- 1542 W Edgemont Ave
- 2055 W Windsor Ave
- 3413 N 16th Dr
- 2147 W Osborn Rd
- 3132 N 15th Ave
- 2047 W Cambridge Ave
- 2969 N 19th Ave Unit 48
- 2969 N 19th Ave Unit 34
- 2969 N 19th Ave Unit 35
- 2969 N 19th Ave Unit 44
- 2969 N 19th Ave Unit 33
- 2969 N 19th Ave Unit 45
- 2969 N 19th Ave Unit 43
- 2969 N 19th Ave Unit 36
- 2969 N 19th Ave Unit 47
- 2969 N 19th Ave Unit 37
- 2969 N 19th Ave Unit 41
- 2969 N 19th Ave Unit 38
- 2969 N 19th Ave Unit 39
- 2969 N 19th Ave Unit 42
- 2953 N 19th Ave Unit 60
- 2953 N 19th Ave Unit 56
- 2953 N 19th Ave Unit 62
- 2953 N 19th Ave Unit 63
- 2953 N 19th Ave Unit 52
- 2953 N 19th Ave Unit 64