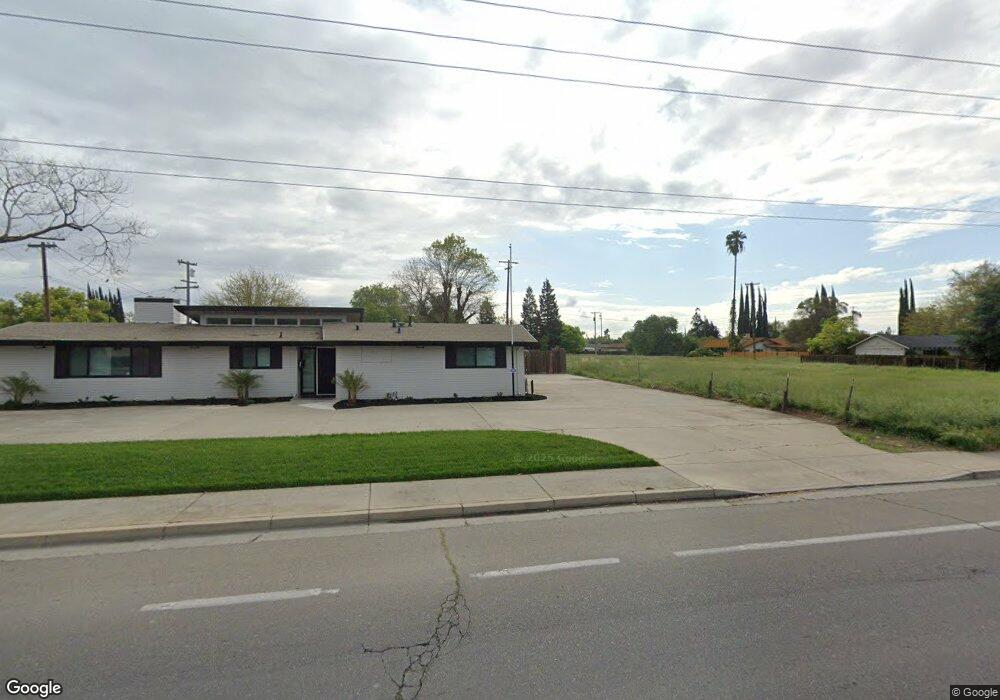
2970 G St Merced, CA 95340
North Merced NeighborhoodEstimated Value: $281,154
Studio
--
Bath
1,505
Sq Ft
$187/Sq Ft
Est. Value
About This Home
This home is located at 2970 G St, Merced, CA 95340 and is currently estimated at $281,154, approximately $186 per square foot. 2970 G St is a home located in Merced County with nearby schools including Luther Burbank Elementary School, Herbert Hoover Middle School, and Merced High School.
Ownership History
Date
Name
Owned For
Owner Type
Purchase Details
Closed on
Oct 6, 2023
Sold by
Pannu Harjinder Kaur
Bought by
Pannu Dilbag Singh
Current Estimated Value
Home Financials for this Owner
Home Financials are based on the most recent Mortgage that was taken out on this home.
Original Mortgage
$100,000
Outstanding Balance
$98,056
Interest Rate
7.18%
Mortgage Type
New Conventional
Estimated Equity
$183,098
Purchase Details
Closed on
Dec 15, 2010
Sold by
Stahl Kay K
Bought by
Stahl Kay K
Create a Home Valuation Report for This Property
The Home Valuation Report is an in-depth analysis detailing your home's value as well as a comparison with similar homes in the area
Home Values in the Area
Average Home Value in this Area
Purchase History
| Date | Buyer | Sale Price | Title Company |
|---|---|---|---|
| Pannu Dilbag Singh | -- | Trans County Title | |
| Pannu Dilbag Singh | $275,000 | Trans County Title | |
| Stahl Kay K | -- | None Available |
Source: Public Records
Mortgage History
| Date | Status | Borrower | Loan Amount |
|---|---|---|---|
| Open | Pannu Dilbag Singh | $100,000 |
Source: Public Records
Tax History
| Year | Tax Paid | Tax Assessment Tax Assessment Total Assessment is a certain percentage of the fair market value that is determined by local assessors to be the total taxable value of land and additions on the property. | Land | Improvement |
|---|---|---|---|---|
| 2025 | $2,952 | $280,500 | $91,800 | $188,700 |
| 2024 | $2,952 | $275,000 | $90,000 | $185,000 |
| 2023 | $2,477 | $229,200 | $118,969 | $110,231 |
| 2022 | $2,444 | $224,707 | $116,637 | $108,070 |
| 2021 | $2,439 | $220,301 | $114,350 | $105,951 |
| 2020 | $2,457 | $218,043 | $113,178 | $104,865 |
| 2019 | $2,420 | $213,768 | $110,959 | $102,809 |
| 2018 | $2,208 | $209,578 | $108,784 | $100,794 |
| 2017 | $2,291 | $205,469 | $106,651 | $98,818 |
| 2016 | $2,256 | $201,441 | $104,560 | $96,881 |
| 2015 | $2,220 | $198,416 | $102,990 | $95,426 |
| 2014 | $2,172 | $194,530 | $100,973 | $93,557 |
Source: Public Records
Map
Nearby Homes
- 27 Emerald Dr
- 2848 Tahoe Dr
- 2819 Tenaya Dr
- 2804 Mccombs Dr
- 688 Elise Ct
- 315 Diane Ct
- 0 E North Bear Creek Dr
- 1 E North Bear Creek Dr
- 439 E Olive Ave
- 3125 El Capitan Ave
- 425 E 27th St
- 261 W 26th St
- 891 Hansen Ave
- 3191 El Capitan Ave
- 121 W 25th St
- 2971 Chestnut Ave
- 2849 Montana Ave
- 822 Seneca St
- 3009 Colony Park Dr
- 8 W 25th St
Your Personal Tour Guide
Ask me questions while you tour the home.