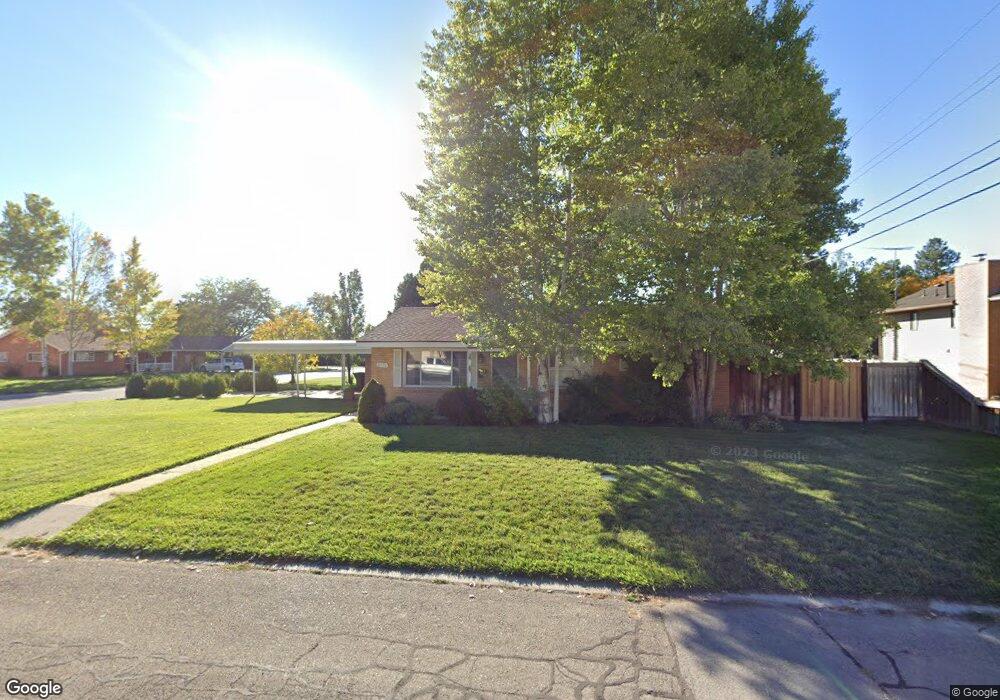
2971 N 320 E Provo, UT 84604
Rock Canyon NeighborhoodEstimated Value: $405,000 - $480,000
2
Beds
1
Bath
1,288
Sq Ft
$340/Sq Ft
Est. Value
About This Home
This home is located at 2971 N 320 E, Provo, UT 84604 and is currently estimated at $438,018, approximately $340 per square foot. 2971 N 320 E is a home located in Utah County with nearby schools including Edgemont School, Centennial Middle School, and Timpview High School.
Ownership History
Date
Name
Owned For
Owner Type
Purchase Details
Closed on
Jul 9, 2008
Sold by
Tingey Tim and Tingey Debra
Bought by
Tingey Tyler B and Tingey Shannel N
Current Estimated Value
Home Financials for this Owner
Home Financials are based on the most recent Mortgage that was taken out on this home.
Original Mortgage
$185,000
Outstanding Balance
$119,167
Interest Rate
6.04%
Mortgage Type
Purchase Money Mortgage
Estimated Equity
$318,851
Purchase Details
Closed on
Mar 28, 2008
Sold by
Tingey Timothy B and Tingey Debra G
Bought by
Tingey Tim and Tingey Debra
Home Financials for this Owner
Home Financials are based on the most recent Mortgage that was taken out on this home.
Original Mortgage
$176,610
Interest Rate
5.72%
Mortgage Type
New Conventional
Create a Home Valuation Report for This Property
The Home Valuation Report is an in-depth analysis detailing your home's value as well as a comparison with similar homes in the area
Home Values in the Area
Average Home Value in this Area
Purchase History
| Date | Buyer | Sale Price | Title Company |
|---|---|---|---|
| Tingey Tyler B | -- | Utah First Title Insurance | |
| Tingey Tim | -- | First American |
Source: Public Records
Mortgage History
| Date | Status | Borrower | Loan Amount |
|---|---|---|---|
| Open | Tingey Tyler B | $185,000 | |
| Previous Owner | Tingey Tim | $176,610 |
Source: Public Records
Tax History
| Year | Tax Paid | Tax Assessment Tax Assessment Total Assessment is a certain percentage of the fair market value that is determined by local assessors to be the total taxable value of land and additions on the property. | Land | Improvement |
|---|---|---|---|---|
| 2025 | $1,999 | $208,175 | -- | -- |
| 2024 | $1,999 | $196,790 | $0 | $0 |
| 2023 | $1,924 | $186,725 | $0 | $0 |
| 2022 | $2,088 | $204,325 | $0 | $0 |
| 2021 | $1,616 | $275,700 | $168,500 | $107,200 |
| 2020 | $1,535 | $245,500 | $140,400 | $105,100 |
| 2019 | $1,393 | $231,800 | $140,400 | $91,400 |
| 2018 | $1,240 | $209,300 | $129,800 | $79,500 |
| 2017 | $1,196 | $110,935 | $0 | $0 |
| 2016 | $1,011 | $87,395 | $0 | $0 |
| 2015 | $976 | $85,250 | $0 | $0 |
| 2014 | $873 | $79,530 | $0 | $0 |
Source: Public Records
Map
Nearby Homes
- 3025 N 250 E
- 2774 N 370 E
- 3013 N 100 W
- 3057 N 100 W
- 2735 N Country Club Dr
- 3221 Shadowbrook Cir
- 2999 N Marrcrest West Dr
- 2939 N Marrcrest Dr W
- 3305 N Shadowbrook Cir
- 111 Candlewood Place
- 3240 Shadowbrook Dr
- 758 E 3030 N
- 5600 N Canyon Rd
- 788 E 2680 N
- 3129 Cherokee Ln
- 158 Woodside Dr
- 2254 N 390 E
- 3711 N Canyon Rd
- 240 E 2230 N Unit 7
- 3250 Mohawk Ln
- 301 E 2950 N
- 2995 N 320 E
- 1612 N 320 E Unit RES
- 1624 N 320 E Unit 6
- 1648 N 320 E Unit 4
- 1660 N 320 E Unit 3
- 1636 N 320 E Unit 5
- 1625 N 320 E Unit 1
- 1615 N 320 E Unit 1
- 1605 N 320 E Unit 2
- 1610 N 320 E Unit 6
- 1610 N 320 E Unit 4
- 1640 N 320 E Unit 4
- 1620 N 320 E Unit 5
- 2974 N 320 E
- 281 E 2950 N
- 3013 N 320 E
- 2988 N 320 E
- 316 E 2950 N
- 300 E 2950 N
Your Personal Tour Guide
Ask me questions while you tour the home.