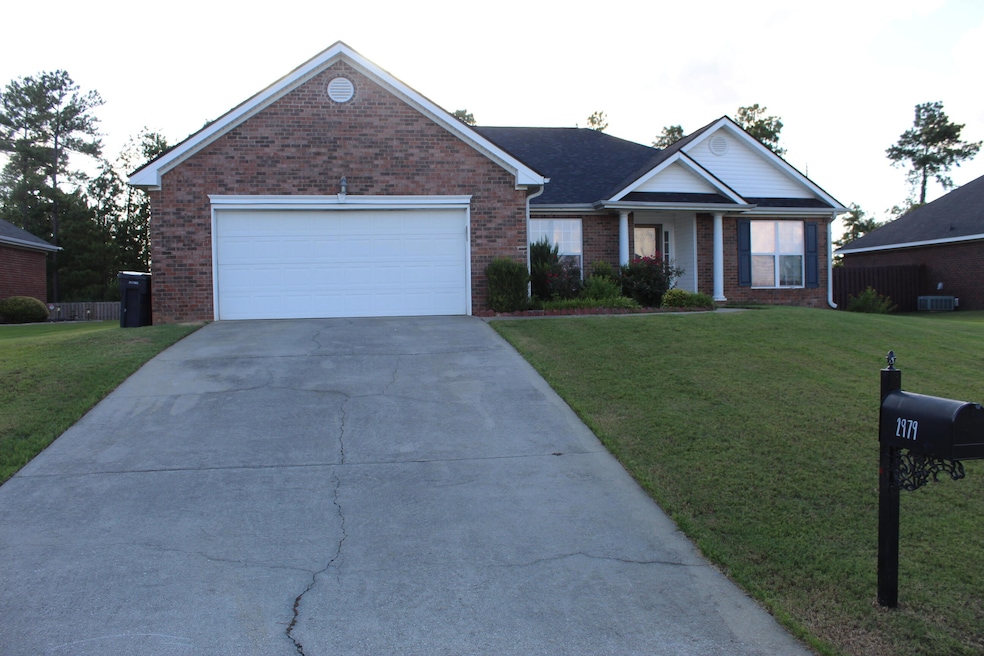
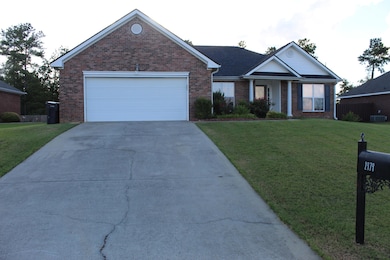
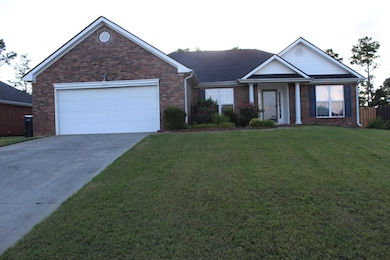
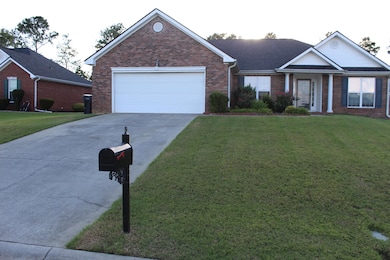
2979 Clarkston Rd Augusta, GA 30909
Belair NeighborhoodHighlights
- Newly Painted Property
- Ranch Style House
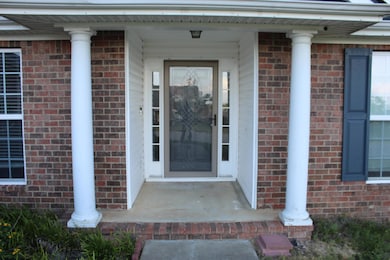
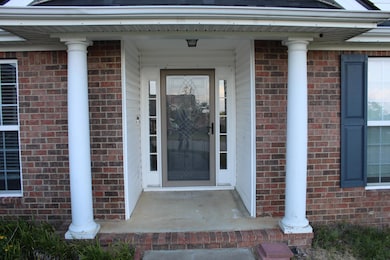
- Covered patio or porch
- Johnson Magnet Rated 10
- No HOA
- Breakfast Room
About This Home
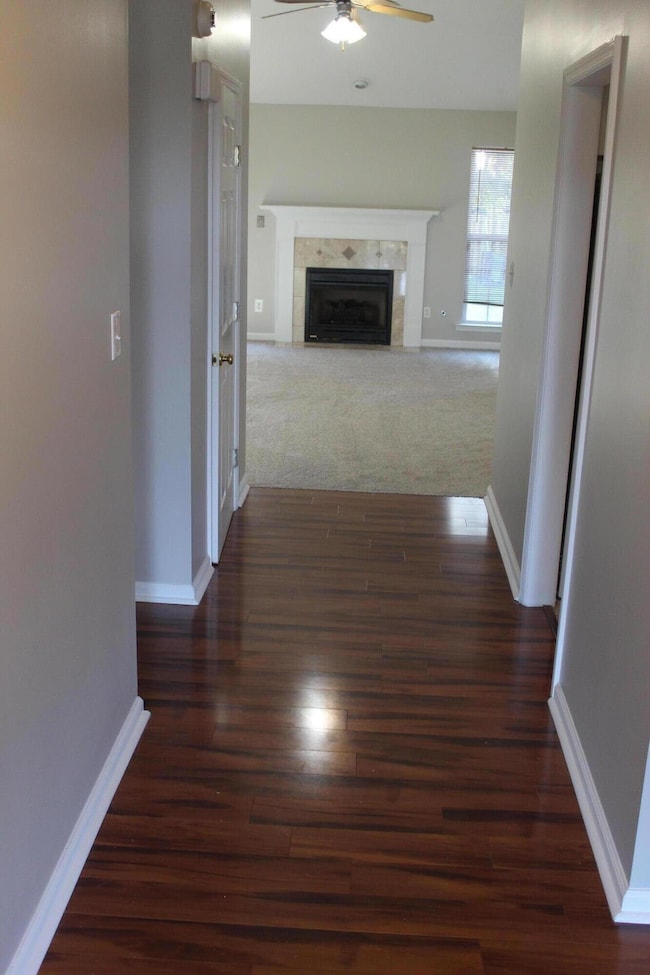
Solid Brick Ranch home with four bedrooms, 2344 Sq Ft, two full baths, a very open floor plan, and freshly painted and new flooring. Only two traffic lights form Fort Gordon Gate 1. This home feature high ceiling and open floor plan, Modern open Kitchen large dining room and breakfast room. Owner suite has large walk-in closet with custom organizer. Owner bathroom has large garden tub and separate walk-in shower and separate water closet (toilet). All other bedroom are spacious. Large laundry room. The home also has a spacious two-car garage with garage openers. Cover Patio, large privacy fenced back yard. 8 X 8 storage. Solid brick ranch home featuring four bedrooms and 2,344 sq ft of living space, with two full baths. The open floor plan is enhanced by fresh paint and new flooring throughout. Conveniently located just two traffic lights from Fort Gordon Gate 1, this home boasts high ceilings and a modern open kitchen that flows into a large dining room and breakfast area.The owner's suite includes a spacious walk-in closet with a custom organizer, and the owner's bathroom features a large garden tub, a separate walk-in shower, and a separate water closet. All other bedrooms are also generously sized. Additionally, there is a large laundry room and a spacious two-car garage equipped with garage door openers. The property includes a covered patio, a large privacy-fenced backyard, and an 8x8 storage shed.
Home Details
Home Type
- Single Family
Year Built
- Built in 2005 | Remodeled
Lot Details
- 0.28 Acre Lot
- Lot Dimensions are 80 x 110
- Privacy Fence
- Fenced
Home Design
- Ranch Style House
- Newly Painted Property
- Brick Exterior Construction
- Slab Foundation
- Composition Roof
Interior Spaces
- 2,344 Sq Ft Home
- Blinds
- Entrance Foyer
- Great Room with Fireplace
- Living Room
- Breakfast Room
- Dining Room
- Pull Down Stairs to Attic
- Fire and Smoke Detector
Kitchen
- Electric Range
- Built-In Microwave
- Ice Maker
- Dishwasher
- Disposal
Flooring
- Carpet
- Laminate
- Ceramic Tile
Bedrooms and Bathrooms
- 4 Bedrooms
- Walk-In Closet
- 2 Full Bathrooms
- Garden Bath
Laundry
- Laundry Room
- Washer and Electric Dryer Hookup
Parking
- Garage
- Garage Door Opener
Outdoor Features
- Covered patio or porch
- Outbuilding
Schools
- Sue Reynolds Elementary School
- Langford Middle School
- Westside Comp. High School
Utilities
- Forced Air Heating System
Community Details
- No Home Owners Association
- Granite Hill Subdivision
Listing and Financial Details
- Assessor Parcel Number 0524052000
Map
Source: REALTORS® of Greater Augusta
MLS Number: 544648
APN: 0524052000
Disclaimer: Certain information contained herein is derived from information provided by parties other than Homes.com. All information provided is deemed reliable, but is not guaranteed to be accurate and should be independently verified.
![]() IDX information is provided exclusively for personal, non-commercial use, and may not be used for any purpose other than to identify prospective properties consumers may be interested in purchasing.
IDX information is provided exclusively for personal, non-commercial use, and may not be used for any purpose other than to identify prospective properties consumers may be interested in purchasing.
Information is deemed reliable but not guaranteed.
- 3422 Covington Ct
- 4086 Harper Franklin Ave
- 4301 Leadville Ct
- 3844 Belair Rd
- 729 Holderness Ct
- 730 Holderness Ct
- 4042 Cottingham Way
- 3650 Crawfordville Dr
- 1068 Burlington Dr
- 1059 Burlington Dr
- 4062 Cottingham Way
- 3655 Crawfordville Dr
- 4061 Cottingham Way
- 5315 Bull St
- 2305 Belair Spring Rd
- 3920 Carolyn St
- 2344 Belair Spring Rd
- 2913 Kings View Dr
- 1144 George W Crawford Dr
- 3647 Madrid Dr N
- 2000 Mchenry Square
- 984 Burlington Dr
- 4018 Cottingham Way
- 3887 Barrett St
- 1400 Pointe Grand Dr
- 2817 Ridgeview Dr
- 3647 Wrightsboro Rd
- 3001 Dr
- 1020 Amli Way
- 101 Little Rock Dr
- 1901 Lauren Ln
- 5000 Sanctuary Dr
- 255 Reservation Way
- 4010 Calypso Dr
- 1150 Interstate Pkwy
- 101 Pine Forest Rd
- 1315 Marks Church Rd
- 1247 Augusta Pkwy W
- 1247 Augusta Pkwy W Unit AVERY
- 1247 Augusta Pkwy W Unit BRANSON
