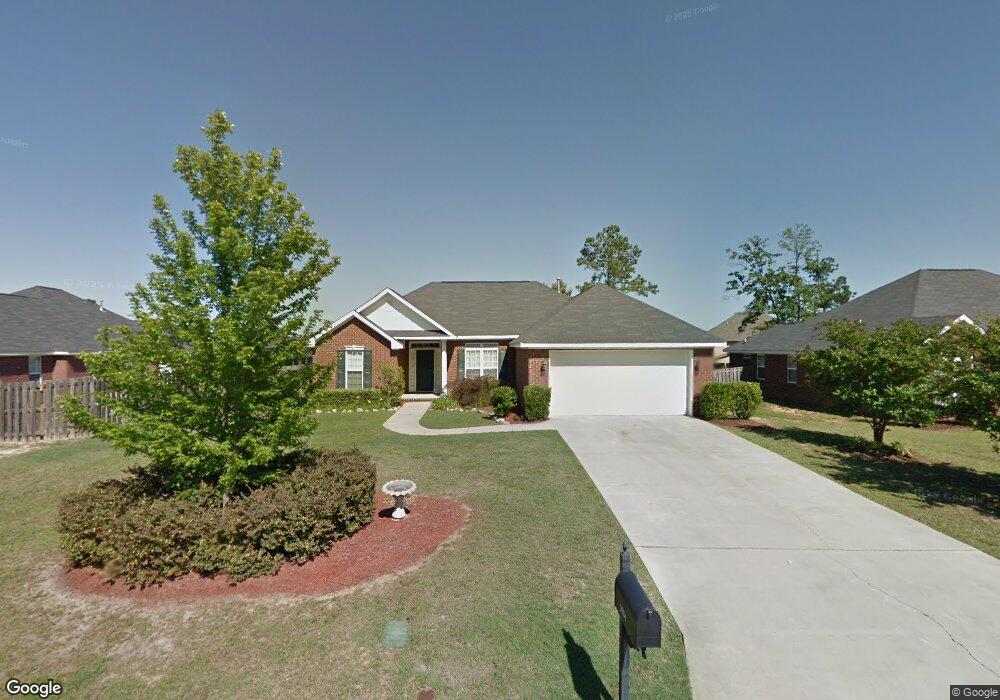
2984 Clarkston Rd Augusta, GA 30909
Belair NeighborhoodEstimated Value: $260,837 - $289,000
3
Beds
2
Baths
1,567
Sq Ft
$172/Sq Ft
Est. Value
About This Home
This home is located at 2984 Clarkston Rd, Augusta, GA 30909 and is currently estimated at $269,959, approximately $172 per square foot. 2984 Clarkston Rd is a home located in Richmond County with nearby schools including Sue Reynolds Elementary School, Langford Middle School, and Johnson Magnet.
Ownership History
Date
Name
Owned For
Owner Type
Purchase Details
Closed on
May 16, 2023
Sold by
Rent Boss Llc
Bought by
Allen J Charles J and Allen Kay K
Current Estimated Value
Purchase Details
Closed on
Jan 31, 2022
Sold by
Shakur Idris S
Bought by
Rent Boss Llc
Home Financials for this Owner
Home Financials are based on the most recent Mortgage that was taken out on this home.
Original Mortgage
$133,000
Interest Rate
3.56%
Mortgage Type
Mortgage Modification
Purchase Details
Closed on
Oct 6, 2005
Sold by
Keystone Homes Inc
Bought by
Shakur Idris S and Shakur Chrystal A
Home Financials for this Owner
Home Financials are based on the most recent Mortgage that was taken out on this home.
Original Mortgage
$154,348
Interest Rate
5.66%
Mortgage Type
VA
Create a Home Valuation Report for This Property
The Home Valuation Report is an in-depth analysis detailing your home's value as well as a comparison with similar homes in the area
Home Values in the Area
Average Home Value in this Area
Purchase History
| Date | Buyer | Sale Price | Title Company |
|---|---|---|---|
| Allen J Charles J | $235,000 | -- | |
| Rent Boss Llc | $157,000 | -- | |
| Shakur Idris S | $151,100 | -- |
Source: Public Records
Mortgage History
| Date | Status | Borrower | Loan Amount |
|---|---|---|---|
| Previous Owner | Rent Boss Llc | $133,000 | |
| Previous Owner | Shakur Idris S | $154,348 |
Source: Public Records
Tax History Compared to Growth
Tax History
| Year | Tax Paid | Tax Assessment Tax Assessment Total Assessment is a certain percentage of the fair market value that is determined by local assessors to be the total taxable value of land and additions on the property. | Land | Improvement |
|---|---|---|---|---|
| 2025 | $3,233 | $102,828 | $14,320 | $88,508 |
| 2024 | $3,233 | $94,000 | $13,440 | $80,560 |
| 2023 | $1,984 | $62,800 | $9,080 | $53,720 |
| 2022 | $2,830 | $86,910 | $14,320 | $72,590 |
| 2021 | $2,455 | $67,007 | $14,320 | $52,687 |
| 2020 | $2,416 | $67,007 | $14,320 | $52,687 |
| 2019 | $2,413 | $62,345 | $14,320 | $48,025 |
| 2018 | $2,430 | $62,345 | $14,320 | $48,025 |
| 2017 | $2,117 | $59,081 | $14,320 | $44,761 |
| 2016 | $2,118 | $59,081 | $14,320 | $44,761 |
| 2015 | $2,133 | $59,081 | $14,320 | $44,761 |
| 2014 | $2,272 | $63,240 | $14,320 | $48,920 |
Source: Public Records
Map
Nearby Homes
- 3422 Covington Ct
- 3416 Covington Ct
- 3312 Camak Dr
- 4086 Harper Franklin Ave
- 3314 Camak Dr
- 4543 Logans Way
- 3985 Belair Rd
- 4321 Regans Ln
- 4308 Regans Ln
- 4002 Cottingham Way
- 729 Holderness Ct
- 3650 Crawfordville Dr
- 4027 Madison Ln
- 4042 Cottingham Way
- 1056 Burlington Dr
- 3025 Brockham Ct
- 5005 Charlie Dr
- 4061 Cottingham Way
- 4829 Apple Ct
- 5316 Bull St
- 2982 Clarkston Rd
- 2990 Clarkston Rd
- 2996 Clarkston Rd
- 3433 Covington Ct
- 2980 Clarkston Rd
- 2985 Clarkston Rd
- 2998 Clarkston Rd
- 2983 Clarkston Rd
- 2987 Clarkston Rd
- 3434 Covington Ct
- 2978 Clarkston Rd
- 2981 Clarkston Rd
- 3431 Covington Ct
- 3002 Clarkston Rd
- 2993 Clarkston Rd
- 2995 Clarkston Rd
- 2989 Clarkston Rd
- 2979 Clarkston Rd
- 2991 Clarkston Rd
- 2976 Clarkston Rd