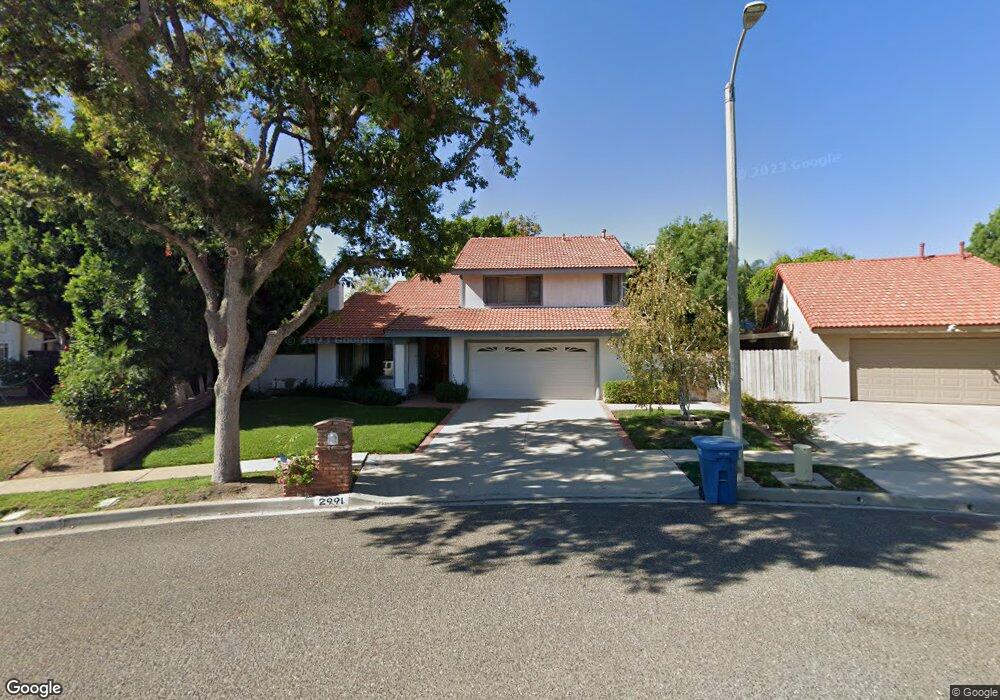
2991 Circle View Dr Simi Valley, CA 93063
Central Simi Valley NeighborhoodEstimated Value: $900,612 - $988,000
4
Beds
3
Baths
1,983
Sq Ft
$481/Sq Ft
Est. Value
About This Home
This home is located at 2991 Circle View Dr, Simi Valley, CA 93063 and is currently estimated at $953,903, approximately $481 per square foot. 2991 Circle View Dr is a home located in Ventura County with nearby schools including Township Elementary School, Valley View Middle School, and Simi Valley High School.
Ownership History
Date
Name
Owned For
Owner Type
Purchase Details
Closed on
Jun 4, 2009
Sold by
Miller Placida C
Bought by
Miller Placida C
Current Estimated Value
Purchase Details
Closed on
Apr 18, 2002
Sold by
Zammikiel Patricia A
Bought by
Zammikiel Patricia A
Home Financials for this Owner
Home Financials are based on the most recent Mortgage that was taken out on this home.
Original Mortgage
$187,000
Interest Rate
7.08%
Purchase Details
Closed on
Sep 7, 1999
Sold by
Zammikiel William Patricia A
Bought by
Zammikiel Patricia A
Purchase Details
Closed on
Mar 15, 1999
Sold by
William Zammikiel and William Patricia A
Bought by
Zammikiel Patricia A
Home Financials for this Owner
Home Financials are based on the most recent Mortgage that was taken out on this home.
Original Mortgage
$185,000
Interest Rate
8%
Create a Home Valuation Report for This Property
The Home Valuation Report is an in-depth analysis detailing your home's value as well as a comparison with similar homes in the area
Home Values in the Area
Average Home Value in this Area
Purchase History
| Date | Buyer | Sale Price | Title Company |
|---|---|---|---|
| Miller Placida C | -- | Pacific Coast Title Company | |
| Zammikiel Patricia A | -- | Chicago Title Co | |
| Zammikiel Patricia A | -- | -- | |
| Zammikiel Patricia A | -- | Stewart Title |
Source: Public Records
Mortgage History
| Date | Status | Borrower | Loan Amount |
|---|---|---|---|
| Closed | Zammikiel Patricia A | $187,000 | |
| Closed | Zammikiel Patricia A | $185,000 |
Source: Public Records
Tax History
| Year | Tax Paid | Tax Assessment Tax Assessment Total Assessment is a certain percentage of the fair market value that is determined by local assessors to be the total taxable value of land and additions on the property. | Land | Improvement |
|---|---|---|---|---|
| 2025 | $3,191 | $214,463 | $26,517 | $187,946 |
| 2024 | $3,191 | $210,258 | $25,997 | $184,261 |
| 2023 | $3,008 | $206,136 | $25,487 | $180,649 |
| 2022 | $2,970 | $202,095 | $24,988 | $177,107 |
| 2021 | $2,925 | $198,133 | $24,498 | $173,635 |
| 2020 | $2,852 | $196,103 | $24,248 | $171,855 |
| 2019 | $2,726 | $192,259 | $23,773 | $168,486 |
| 2018 | $2,688 | $188,490 | $23,307 | $165,183 |
| 2017 | $2,620 | $184,795 | $22,850 | $161,945 |
| 2016 | $2,504 | $181,172 | $22,402 | $158,770 |
| 2015 | $2,442 | $178,452 | $22,066 | $156,386 |
| 2014 | $2,395 | $174,959 | $21,635 | $153,324 |
Source: Public Records
Map
Nearby Homes
- 2972 Ivory Ave
- 3279 Avenida Simi
- 6505 Canyon Oaks Dr
- 3039 Country Ln
- 3477 Vicki Ct
- 3259 Valarie Ave
- 3319 Township Ave
- 3445 Highwood Ct Unit 128
- 3434 Highwood Ct Unit 183
- 3474 Highwood Ct Unit 80
- 3458 Highwood Ct Unit 198
- 3307 Cole Ave
- 2727 Reservoir Dr
- 3049 Tallahassee Ln
- 2696 Santa Ynez Ave
- 3550 Woodhaven St
- 3264 Darby St Unit 142
- 3210 Darby St Unit 102
- 3648 Woodhaven St
- 2579 Little Rock Ln
- 3415 Circle View Dr
- 2969 Circle View Dr
- 3404 Avenida Simi
- 3423 Circle View Dr
- 3416 Avenida Simi
- 2953 Circle View Dr
- 2970 Circle View Dr
- 2997 Topaz Ave
- 3424 Avenida Simi
- 2990 Topaz Ave
- 3435 Circle View Dr
- 3390 Avenida Simi
- 2954 Circle View Dr
- 2931 Circle View Dr
- 3436 Avenida Simi
- 2978 Topaz Ave
- 2985 Topaz Ave
- 3434 Circle View Dr
- 3378 Avenida Simi
- 3407 Avenida Simi
Your Personal Tour Guide
Ask me questions while you tour the home.