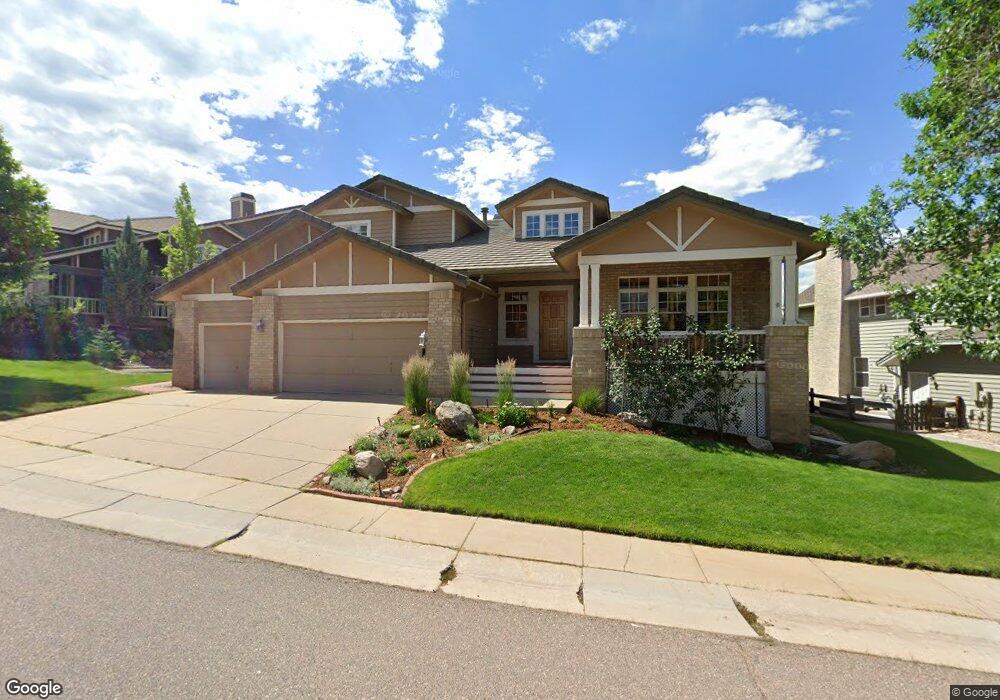
3 Amaranth Dr Littleton, CO 80127
Ken Caryl Ranch NeighborhoodEstimated Value: $1,346,000 - $1,536,000
4
Beds
7
Baths
3,705
Sq Ft
$378/Sq Ft
Est. Value
About This Home
This home is located at 3 Amaranth Dr, Littleton, CO 80127 and is currently estimated at $1,401,778, approximately $378 per square foot. 3 Amaranth Dr is a home located in Jefferson County with nearby schools including Bradford K8 South, Bradford K8 North, and Chatfield High School.
Ownership History
Date
Name
Owned For
Owner Type
Purchase Details
Closed on
Mar 15, 2022
Sold by
Castellano Anthony J
Bought by
Castellano Sonia M and Castellano Anthony J
Current Estimated Value
Purchase Details
Closed on
Aug 4, 1995
Sold by
Lindsay Max M and Lindsay Sharon M
Bought by
Solarte Joseph A and Bishop Virginia C
Home Financials for this Owner
Home Financials are based on the most recent Mortgage that was taken out on this home.
Original Mortgage
$274,400
Interest Rate
7.54%
Create a Home Valuation Report for This Property
The Home Valuation Report is an in-depth analysis detailing your home's value as well as a comparison with similar homes in the area
Home Values in the Area
Average Home Value in this Area
Purchase History
| Date | Buyer | Sale Price | Title Company |
|---|---|---|---|
| Castellano Sonia M | -- | None Listed On Document | |
| Solarte Joseph A | $343,000 | -- |
Source: Public Records
Mortgage History
| Date | Status | Borrower | Loan Amount |
|---|---|---|---|
| Previous Owner | Solarte Joseph A | $274,400 |
Source: Public Records
Tax History Compared to Growth
Tax History
| Year | Tax Paid | Tax Assessment Tax Assessment Total Assessment is a certain percentage of the fair market value that is determined by local assessors to be the total taxable value of land and additions on the property. | Land | Improvement |
|---|---|---|---|---|
| 2024 | $8,577 | $80,115 | $23,157 | $56,958 |
| 2023 | $8,577 | $80,115 | $23,157 | $56,958 |
| 2022 | $7,325 | $66,913 | $22,217 | $44,696 |
| 2021 | $7,437 | $68,838 | $22,856 | $45,982 |
| 2020 | $6,670 | $61,934 | $18,933 | $43,001 |
| 2019 | $6,590 | $61,934 | $18,933 | $43,001 |
| 2018 | $6,061 | $55,012 | $15,298 | $39,714 |
| 2017 | $5,637 | $55,012 | $15,298 | $39,714 |
| 2016 | $5,600 | $51,725 | $16,279 | $35,446 |
| 2015 | $5,512 | $51,725 | $16,279 | $35,446 |
| 2014 | $5,512 | $47,971 | $12,215 | $35,756 |
Source: Public Records
Map
Nearby Homes
- 63 Buckthorn Dr
- 4 Oakmont Ln
- 29 Desert Willow Ln
- 7 Red Fox Ln
- 6 Blue Grouse Ridge Rd
- 7326 S Yank Ct
- Stonehaven Plan at Ken-Caryl Ranch - The Monarch Collection
- Ashbrook Plan at Ken-Caryl Ranch - The Monarch Collection
- Chelton Plan at Ken-Caryl Ranch - The Monarch Collection
- Springdale Plan at Ken-Caryl Ranch - The Monarch Collection
- 12767 W Geddes Dr
- 12757 W Geddes Dr
- 7125 S Youngfield Way
- 7195 S Youngfield Way
- 12728 W Geddes Dr
- 12769 W Glasgow Place
- 12750 W Glasgow Place
- 12708 W Geddes Dr
- 12727 W Geddes Dr
- 12698 W Geddes Dr