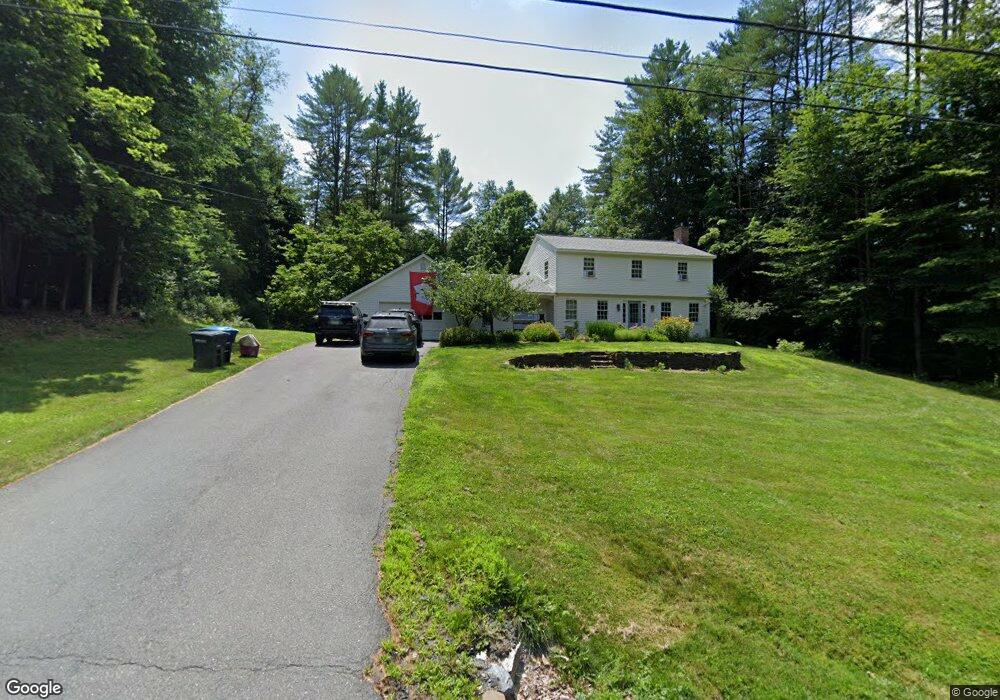
3 Butternut Ln Hanover, NH 03755
Estimated Value: $1,082,000 - $1,556,000
4
Beds
4
Baths
1,970
Sq Ft
$671/Sq Ft
Est. Value
About This Home
This home is located at 3 Butternut Ln, Hanover, NH 03755 and is currently estimated at $1,322,240, approximately $671 per square foot. 3 Butternut Ln is a home located in Grafton County with nearby schools including Bernice A. Ray School, Frances C. Richmond School, and Hanover High School.
Ownership History
Date
Name
Owned For
Owner Type
Purchase Details
Closed on
Jul 20, 2022
Sold by
Stafford Michael A and Stafford Angela B
Bought by
Ryckman Emily
Current Estimated Value
Home Financials for this Owner
Home Financials are based on the most recent Mortgage that was taken out on this home.
Original Mortgage
$550,000
Outstanding Balance
$522,394
Interest Rate
5.23%
Mortgage Type
Purchase Money Mortgage
Estimated Equity
$799,846
Purchase Details
Closed on
Jun 21, 2005
Sold by
Udy Marjorie Lee
Bought by
Stafford Michel A and Safford Angela
Home Financials for this Owner
Home Financials are based on the most recent Mortgage that was taken out on this home.
Original Mortgage
$180,000
Interest Rate
6%
Mortgage Type
Adjustable Rate Mortgage/ARM
Create a Home Valuation Report for This Property
The Home Valuation Report is an in-depth analysis detailing your home's value as well as a comparison with similar homes in the area
Home Values in the Area
Average Home Value in this Area
Purchase History
| Date | Buyer | Sale Price | Title Company |
|---|---|---|---|
| Ryckman Emily | $1,100,000 | None Available | |
| Stafford Michel A | $635,000 | -- |
Source: Public Records
Mortgage History
| Date | Status | Borrower | Loan Amount |
|---|---|---|---|
| Open | Ryckman Emily | $550,000 | |
| Previous Owner | Stafford Michel A | $180,000 |
Source: Public Records
Tax History Compared to Growth
Tax History
| Year | Tax Paid | Tax Assessment Tax Assessment Total Assessment is a certain percentage of the fair market value that is determined by local assessors to be the total taxable value of land and additions on the property. | Land | Improvement |
|---|---|---|---|---|
| 2024 | $15,886 | $824,400 | $433,700 | $390,700 |
| 2023 | $15,284 | $824,400 | $433,700 | $390,700 |
| 2022 | $14,666 | $824,400 | $433,700 | $390,700 |
| 2021 | $14,542 | $824,400 | $433,700 | $390,700 |
| 2020 | $13,064 | $646,400 | $391,500 | $254,900 |
| 2019 | $12,883 | $646,400 | $391,500 | $254,900 |
| 2018 | $12,025 | $646,400 | $391,500 | $254,900 |
| 2017 | $11,802 | $549,300 | $273,200 | $276,100 |
| 2016 | $11,695 | $549,300 | $273,200 | $276,100 |
| 2015 | $11,469 | $549,300 | $273,200 | $276,100 |
| 2014 | $11,002 | $549,300 | $273,200 | $276,100 |
| 2013 | $10,607 | $549,300 | $273,200 | $276,100 |
| 2012 | $10,526 | $569,300 | $286,000 | $283,300 |
Source: Public Records
Map
Nearby Homes
- 131 Brook Hollow
- 126 Brook Hollow
- 33 E Wheelock St
- 37 Low Rd
- 32 Melview Ridge
- 85 Lebanon St
- 5 College Hill
- 51 Loveland Rd
- 0 U S 5
- 153 Greensboro Rd
- 187 Hopson Rd
- 5 E Wilder Rd
- 00 Olcott Rd Unit 189
- 9 Walnut St
- 0 Barrister Dr Unit 3
- 46A Barrister Dr Unit 205
- 00 Bradley Hill Rd Unit 121
- 36 Juniper Dr Unit 6B
- 2577 Hartford Ave
- 13 Hawthorn St