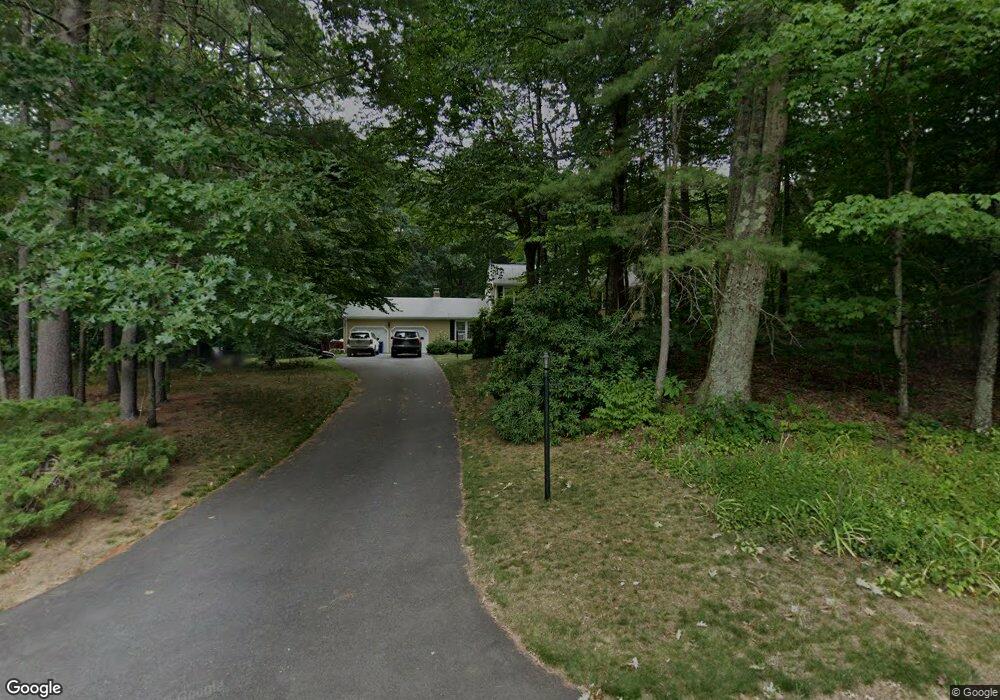
3 Fox Ln Milford, MA 01757
Estimated Value: $678,000 - $699,000
4
Beds
3
Baths
2,388
Sq Ft
$289/Sq Ft
Est. Value
About This Home
This home is located at 3 Fox Ln, Milford, MA 01757 and is currently estimated at $689,154, approximately $288 per square foot. 3 Fox Ln is a home located in Worcester County with nearby schools including Milford High School.
Ownership History
Date
Name
Owned For
Owner Type
Purchase Details
Closed on
Oct 6, 2021
Sold by
Mirenda Lt
Bought by
Mirenda Jesse C
Current Estimated Value
Home Financials for this Owner
Home Financials are based on the most recent Mortgage that was taken out on this home.
Original Mortgage
$510,000
Outstanding Balance
$465,072
Interest Rate
2.8%
Mortgage Type
Purchase Money Mortgage
Estimated Equity
$224,082
Purchase Details
Closed on
Dec 19, 2017
Sold by
Mirenda Joseph P and Mirenda Lorna A
Bought by
Mirenda Lt
Purchase Details
Closed on
Sep 7, 1990
Sold by
Digrezio William V
Bought by
Mirenda Joseph P
Home Financials for this Owner
Home Financials are based on the most recent Mortgage that was taken out on this home.
Original Mortgage
$31,000
Interest Rate
9.76%
Create a Home Valuation Report for This Property
The Home Valuation Report is an in-depth analysis detailing your home's value as well as a comparison with similar homes in the area
Home Values in the Area
Average Home Value in this Area
Purchase History
| Date | Buyer | Sale Price | Title Company |
|---|---|---|---|
| Mirenda Jesse C | $510,000 | None Available | |
| Mirenda Lt | -- | -- | |
| Mirenda Joseph P | $182,000 | -- |
Source: Public Records
Mortgage History
| Date | Status | Borrower | Loan Amount |
|---|---|---|---|
| Open | Mirenda Jesse C | $510,000 | |
| Previous Owner | Mirenda Joseph P | $100,000 | |
| Previous Owner | Mirenda Joseph P | $31,000 | |
| Previous Owner | Mirenda Joseph P | $70,000 |
Source: Public Records
Tax History Compared to Growth
Tax History
| Year | Tax Paid | Tax Assessment Tax Assessment Total Assessment is a certain percentage of the fair market value that is determined by local assessors to be the total taxable value of land and additions on the property. | Land | Improvement |
|---|---|---|---|---|
| 2025 | $6,867 | $536,500 | $219,800 | $316,700 |
| 2024 | $6,866 | $516,600 | $211,100 | $305,500 |
| 2023 | $6,479 | $448,400 | $182,700 | $265,700 |
| 2022 | $6,210 | $403,500 | $167,400 | $236,100 |
| 2021 | $5,061 | $377,300 | $167,400 | $209,900 |
| 2020 | $5,964 | $373,700 | $167,400 | $206,300 |
| 2019 | $5,845 | $353,400 | $167,400 | $186,000 |
| 2018 | $5,781 | $349,100 | $163,100 | $186,000 |
| 2017 | $5,663 | $337,300 | $163,100 | $174,200 |
| 2016 | $5,602 | $326,100 | $163,100 | $163,000 |
| 2015 | $5,488 | $312,700 | $154,400 | $158,300 |
Source: Public Records
Map
Nearby Homes