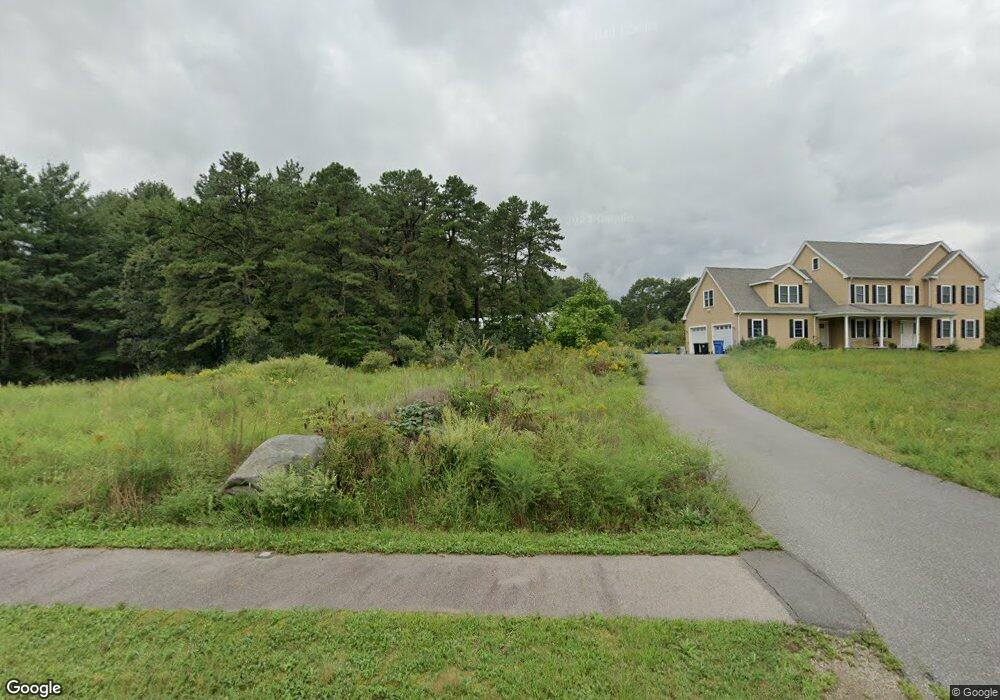
3 Hatch Rd Wrentham, MA 02093
West Wrentham NeighborhoodEstimated Value: $1,167,290
4
Beds
3
Baths
3,870
Sq Ft
$302/Sq Ft
Est. Value
About This Home
This home is located at 3 Hatch Rd, Wrentham, MA 02093 and is currently priced at $1,167,290, approximately $301 per square foot. 3 Hatch Rd is a home located in Norfolk County with nearby schools including Delaney Elementary School, Charles E Roderick, and Mercymount Country Day School.
Ownership History
Date
Name
Owned For
Owner Type
Purchase Details
Closed on
Dec 17, 2015
Sold by
Demetra Farm T and Siakotos Michael N
Bought by
Siakotos Michael N
Current Estimated Value
Create a Home Valuation Report for This Property
The Home Valuation Report is an in-depth analysis detailing your home's value as well as a comparison with similar homes in the area
Home Values in the Area
Average Home Value in this Area
Purchase History
| Date | Buyer | Sale Price | Title Company |
|---|---|---|---|
| Siakotos Michael N | -- | -- |
Source: Public Records
Tax History
| Year | Tax Paid | Tax Assessment Tax Assessment Total Assessment is a certain percentage of the fair market value that is determined by local assessors to be the total taxable value of land and additions on the property. | Land | Improvement |
|---|---|---|---|---|
| 2025 | $11,807 | $1,018,700 | $289,000 | $729,700 |
| 2024 | $11,143 | $928,600 | $289,000 | $639,600 |
| 2023 | $11,256 | $891,900 | $262,900 | $629,000 |
| 2022 | $10,890 | $796,600 | $256,100 | $540,500 |
| 2021 | $10,358 | $736,200 | $239,400 | $496,800 |
| 2020 | $10,938 | $767,600 | $183,000 | $584,600 |
| 2019 | $10,457 | $740,600 | $183,000 | $557,600 |
| 2018 | $9,122 | $640,600 | $182,800 | $457,800 |
| 2017 | $8,926 | $626,400 | $179,300 | $447,100 |
| 2016 | $8,809 | $616,900 | $174,100 | $442,800 |
| 2015 | $4,650 | $310,400 | $84,200 | $226,200 |
| 2014 | $2,635 | $172,100 | $73,000 | $99,100 |
Source: Public Records
Map
Nearby Homes
- 10 Follett Dr
- 9 Reagan Ave
- 1620 West St
- 60 Grant Ave
- 900 Washington St Lot 2
- 925 Washington St
- 25 Nature View Dr
- 1 Spring St
- 20 Nature View Dr
- 365 W Wrentham Rd
- 172 Pine Swamp Rd
- 180 Pine Swamp Rd
- 56 Pine Swamp Rd
- 9 Pebble Cir Unit 9
- 18 Bubbling Brook Rd
- 9 Brookfield Ln
- 23 Palmetto Dr Unit 23
- 21 Palmetto Dr Unit 21
- 24 Palmetto Dr Unit 24
- 47 Austin Dr
Your Personal Tour Guide
Ask me questions while you tour the home.