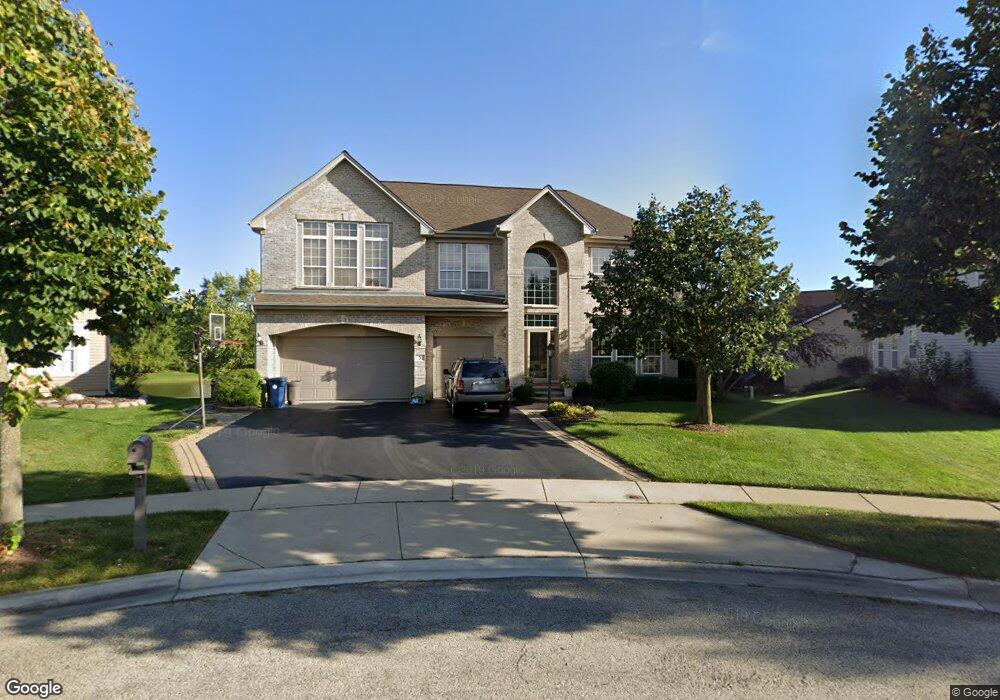
3 Joyce Ct Algonquin, IL 60102
Estimated Value: $547,833 - $655,000
3
Beds
--
Bath
3,778
Sq Ft
$158/Sq Ft
Est. Value
About This Home
This home is located at 3 Joyce Ct, Algonquin, IL 60102 and is currently estimated at $597,458, approximately $158 per square foot. 3 Joyce Ct is a home located in Kane County with nearby schools including Westfield Community School and Harry D Jacobs High School.
Ownership History
Date
Name
Owned For
Owner Type
Purchase Details
Closed on
Nov 22, 2017
Sold by
Camodeca Nancy E
Bought by
Camodeca Nancy E
Current Estimated Value
Purchase Details
Closed on
Jul 14, 2000
Sold by
Willoughby Farms Ltd Partnership
Bought by
Camodeca Jeffrey F and Camodeca Nancy E
Home Financials for this Owner
Home Financials are based on the most recent Mortgage that was taken out on this home.
Original Mortgage
$331,200
Outstanding Balance
$118,598
Interest Rate
8.24%
Estimated Equity
$478,860
Create a Home Valuation Report for This Property
The Home Valuation Report is an in-depth analysis detailing your home's value as well as a comparison with similar homes in the area
Purchase History
| Date | Buyer | Sale Price | Title Company |
|---|---|---|---|
| Camodeca Nancy E | -- | Attorney | |
| Camodeca Nancy E | -- | Attorney | |
| Camodeca Jeffrey F | $410,000 | Stewart Title Company |
Source: Public Records
Mortgage History
| Date | Status | Borrower | Loan Amount |
|---|---|---|---|
| Open | Camodeca Jeffrey F | $331,200 |
Source: Public Records
Tax History
| Year | Tax Paid | Tax Assessment Tax Assessment Total Assessment is a certain percentage of the fair market value that is determined by local assessors to be the total taxable value of land and additions on the property. | Land | Improvement |
|---|---|---|---|---|
| 2024 | $12,605 | $174,431 | $28,016 | $146,415 |
| 2023 | $11,985 | $156,947 | $25,208 | $131,739 |
| 2022 | $11,598 | $146,792 | $25,208 | $121,584 |
| 2021 | $11,254 | $138,600 | $23,801 | $114,799 |
| 2020 | $11,030 | $135,484 | $23,266 | $112,218 |
| 2019 | $10,697 | $128,616 | $22,087 | $106,529 |
| 2018 | $10,772 | $126,070 | $21,650 | $104,420 |
| 2017 | $10,331 | $117,933 | $20,253 | $97,680 |
| 2016 | $10,722 | $115,525 | $19,610 | $95,915 |
| 2015 | -- | $104,491 | $17,040 | $87,451 |
| 2014 | -- | $98,369 | $16,569 | $81,800 |
| 2013 | -- | $101,380 | $17,076 | $84,304 |
Source: Public Records
Map
Nearby Homes
- 1101 Waterford St
- 1121 Waterford St
- 2313 Barrett Dr
- 2258 Stonegate Rd
- 120 Newburgh Ln
- 1240 Glenmont St
- 1201 Waterford St
- 1090 Glenmont St
- 1111 Glenmont St
- 1243 Glenmont St
- 1080 Glenmont St
- 1249 Glenmont St
- 1245 Glenmont St
- 1020 Glenmont St
- 1211 Waterford St
- 150 Newburgh Ln
- 1262 Glenmont St
- 2254 Stonegate Rd
- 1256 Glenmont St
- 2248 Stonegate Rd
Your Personal Tour Guide
Ask me questions while you tour the home.