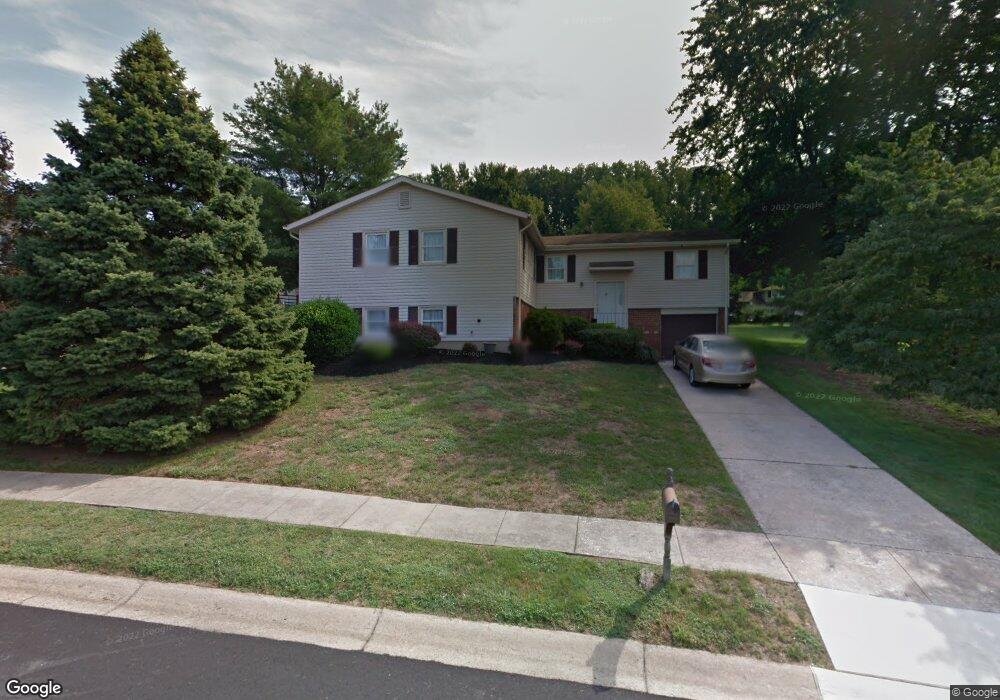
3 Pinyon Pine Cir Unit 41 Wilmington, DE 19808
Estimated Value: $394,000 - $486,000
3
Beds
2
Baths
1,860
Sq Ft
$242/Sq Ft
Est. Value
About This Home
This home is located at 3 Pinyon Pine Cir Unit 41, Wilmington, DE 19808 and is currently estimated at $449,802, approximately $241 per square foot. 3 Pinyon Pine Cir Unit 41 is a home located in New Castle County with nearby schools including Linden Hill Elementary School, Skyline Middle School, and Dickinson (John) High School.
Ownership History
Date
Name
Owned For
Owner Type
Purchase Details
Closed on
Dec 20, 2023
Sold by
Turney Rachel and Turney Brandon
Bought by
Dunlap Christopher L and Dunlap Brooke
Current Estimated Value
Home Financials for this Owner
Home Financials are based on the most recent Mortgage that was taken out on this home.
Original Mortgage
$15,611
Outstanding Balance
$15,365
Interest Rate
7.5%
Estimated Equity
$434,437
Purchase Details
Closed on
Sep 9, 2022
Sold by
Brown Watson F
Bought by
Turney Rachel and Turney Brandon
Home Financials for this Owner
Home Financials are based on the most recent Mortgage that was taken out on this home.
Original Mortgage
$384,750
Interest Rate
5.22%
Mortgage Type
New Conventional
Purchase Details
Closed on
Jan 1, 1974
Bought by
Brown Watson F
Create a Home Valuation Report for This Property
The Home Valuation Report is an in-depth analysis detailing your home's value as well as a comparison with similar homes in the area
Home Values in the Area
Average Home Value in this Area
Purchase History
| Date | Buyer | Sale Price | Title Company |
|---|---|---|---|
| Dunlap Christopher L | -- | None Listed On Document | |
| Turney Rachel | -- | -- | |
| Brown Watson F | $43,800 | -- |
Source: Public Records
Mortgage History
| Date | Status | Borrower | Loan Amount |
|---|---|---|---|
| Open | Dunlap Christopher L | $15,611 | |
| Open | Dunlap Christopher L | $390,299 | |
| Previous Owner | Turney Rachel | $384,750 |
Source: Public Records
Tax History Compared to Growth
Tax History
| Year | Tax Paid | Tax Assessment Tax Assessment Total Assessment is a certain percentage of the fair market value that is determined by local assessors to be the total taxable value of land and additions on the property. | Land | Improvement |
|---|---|---|---|---|
| 2024 | $2,731 | $73,900 | $14,000 | $59,900 |
| 2023 | $2,409 | $73,900 | $14,000 | $59,900 |
| 2022 | $1,673 | $73,900 | $14,000 | $59,900 |
| 2021 | $1,983 | $73,900 | $14,000 | $59,900 |
| 2020 | $1,983 | $73,900 | $14,000 | $59,900 |
| 2019 | $1,983 | $73,900 | $14,000 | $59,900 |
| 2018 | $161 | $73,900 | $14,000 | $59,900 |
| 2017 | $1,757 | $73,900 | $14,000 | $59,900 |
| 2016 | $1,757 | $73,900 | $14,000 | $59,900 |
| 2015 | $1,615 | $73,900 | $14,000 | $59,900 |
| 2014 | $1,457 | $73,900 | $14,000 | $59,900 |
Source: Public Records
Map
Nearby Homes
- 4988 Mermaid Blvd
- 7 Ridge Blvd
- 4813 #2 Hogan Dr
- 4815 Hogan Dr
- 4811 Hogan Dr Unit 3
- 4809 Hogan Dr Unit 4
- 4807 Hogan Dr Unit 5
- 477 Upper Pike Creek Rd
- 4805 Hogan Dr Unit 6
- 4803 Hogan Dr Unit 7
- 4810 Plum Run Ct
- 3600 Rustic Ln Unit 245
- 3600 Rustic Ln Unit 211
- 3600 Rustic Ln Unit 236
- 3601 526 Hewn Ln Unit 526
- 148 Drummond Farms Ln
- 4934 W Brigantine Ct Unit 4934
- 4938 W Brigantine Ct Unit 4938
- 4702 Linden Knoll Dr Unit 325
- 4824 W Brigantine Ct Unit 4824
- 3 Pinyon Pine Cir
- 5 Pinyon Pine Cir
- 5803 Stone Pine Rd
- 5009 The Pines Blvd
- 5009 Pines Blvd
- 23 Pinyon Pine Cir
- 5011 The Pines Blvd
- 5007 The Pines Blvd
- 7 Pinyon Pine Cir
- 5005 The Pines Blvd
- 5901 Stone Pine Rd
- 1 White Pine Ct
- 5003 The Pines Blvd
- 9 Pinyon Pine Cir
- 5800 Stone Pine Rd
- 5802 Stone Pine Rd
- 5903 Stone Pine Rd
- 3 White Pine Ct
- 5015 The Pines Blvd
- 5001 The Pines Blvd