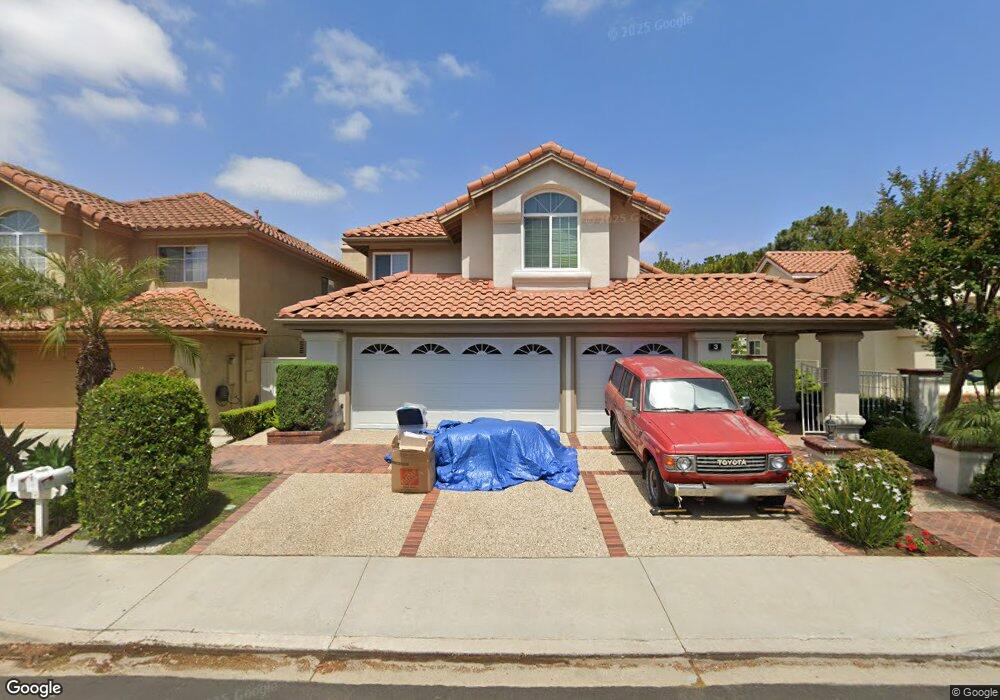
3 Salerno Irvine, CA 92614
Westpark NeighborhoodEstimated Value: $2,174,802 - $2,405,000
5
Beds
3
Baths
2,817
Sq Ft
$823/Sq Ft
Est. Value
About This Home
This home is located at 3 Salerno, Irvine, CA 92614 and is currently estimated at $2,318,451, approximately $823 per square foot. 3 Salerno is a home located in Orange County with nearby schools including Culverdale Elementary School, Westpark Elementary School, and South Lake Middle School.
Ownership History
Date
Name
Owned For
Owner Type
Purchase Details
Closed on
Aug 29, 2019
Sold by
Hsieh Samuel and Hsieh Yichen
Bought by
Hsieh Samuel Chong and Hsieh Yi Chen Tseng
Current Estimated Value
Purchase Details
Closed on
Mar 28, 2018
Sold by
Hsieh Henry
Bought by
Hsieh Samuel and Hsieh Yichen
Purchase Details
Closed on
May 11, 2009
Sold by
Hsieh Yichen
Bought by
Hsieh Samuel
Purchase Details
Closed on
May 1, 2009
Sold by
Uy Luis A and Uy Michelle J
Bought by
Hsieh Samuel and Hsieh Henry
Purchase Details
Closed on
Nov 3, 2003
Sold by
Uy Luis A
Bought by
Uy Luis A
Home Financials for this Owner
Home Financials are based on the most recent Mortgage that was taken out on this home.
Original Mortgage
$337,000
Interest Rate
6%
Mortgage Type
Purchase Money Mortgage
Purchase Details
Closed on
Mar 26, 1997
Sold by
Peralta Maria Regina
Bought by
Uy Luis A
Purchase Details
Closed on
Mar 27, 1996
Sold by
Parsa Abbas Thomas and Parsa Fariba
Bought by
Uy Luis A and Peralta Maria Regina
Home Financials for this Owner
Home Financials are based on the most recent Mortgage that was taken out on this home.
Original Mortgage
$353,500
Interest Rate
8.01%
Create a Home Valuation Report for This Property
The Home Valuation Report is an in-depth analysis detailing your home's value as well as a comparison with similar homes in the area
Home Values in the Area
Average Home Value in this Area
Purchase History
| Date | Buyer | Sale Price | Title Company |
|---|---|---|---|
| Hsieh Samuel Chong | -- | None Available | |
| Hsieh Samuel | -- | None Available | |
| Hsieh Samuel | -- | None Available | |
| Hsieh Samuel | $917,000 | None Available | |
| Uy Luis A | -- | Diversified Title Company | |
| Uy Luis A | -- | -- | |
| Uy Luis A | $442,000 | Gateway Title Company |
Source: Public Records
Mortgage History
| Date | Status | Borrower | Loan Amount |
|---|---|---|---|
| Previous Owner | Uy Luis A | $337,000 | |
| Previous Owner | Uy Luis A | $353,500 |
Source: Public Records
Tax History Compared to Growth
Tax History
| Year | Tax Paid | Tax Assessment Tax Assessment Total Assessment is a certain percentage of the fair market value that is determined by local assessors to be the total taxable value of land and additions on the property. | Land | Improvement |
|---|---|---|---|---|
| 2025 | $12,423 | $1,180,871 | $830,511 | $350,360 |
| 2024 | $12,423 | $1,157,717 | $814,226 | $343,491 |
| 2023 | $12,105 | $1,135,017 | $798,261 | $336,756 |
| 2022 | $11,880 | $1,112,762 | $782,609 | $330,153 |
| 2021 | $11,612 | $1,090,944 | $767,264 | $323,680 |
| 2020 | $11,547 | $1,079,758 | $759,396 | $320,362 |
| 2019 | $11,976 | $1,058,587 | $744,506 | $314,081 |
| 2018 | $11,780 | $1,037,831 | $729,908 | $307,923 |
| 2017 | $11,552 | $1,017,482 | $715,596 | $301,886 |
| 2016 | $11,072 | $997,532 | $701,565 | $295,967 |
| 2015 | $10,916 | $982,549 | $691,027 | $291,522 |
| 2014 | $10,718 | $963,303 | $677,491 | $285,812 |
Source: Public Records
Map
Nearby Homes
- 5 Bergamo
- 3871 Hendrix St Unit 2
- 3871 Hendrix St
- 30 Fox Hollow Unit 67
- 68 Timber Run Unit 45
- 32 Comiso
- 10 Laconia
- 81 Rockwood Unit 42
- 3 Almador
- 74 Havenwood Unit 41
- 145 Greenfield
- 116 Almador
- 87 Greenfield
- 40 Havenwood
- 11 Thunder Trail Unit 6
- 76 Racing Wind
- 21 Medici Aisle
- 90 Costero Aisle Unit 284
- 89 Alberti Aisle
- 21 Greenbough Unit 124