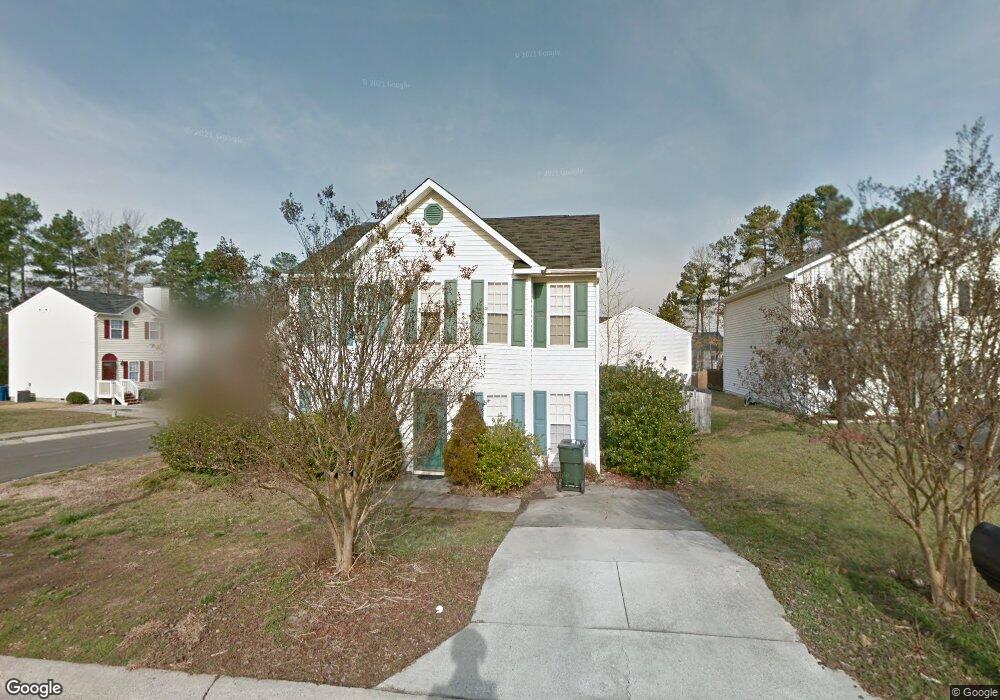
3 Tumlin Ct Durham, NC 27703
Eastern Durham NeighborhoodEstimated Value: $308,000 - $321,965
3
Beds
3
Baths
1,752
Sq Ft
$180/Sq Ft
Est. Value
About This Home
This home is located at 3 Tumlin Ct, Durham, NC 27703 and is currently estimated at $315,741, approximately $180 per square foot. 3 Tumlin Ct is a home located in Durham County with nearby schools including Glenn Elementary, John W Neal Middle School, and Southern School of Energy & Sustainability.
Ownership History
Date
Name
Owned For
Owner Type
Purchase Details
Closed on
Nov 23, 2009
Sold by
Secretary Of Housing & Urban Development
Bought by
Wilson Fredrick Jeuron
Current Estimated Value
Home Financials for this Owner
Home Financials are based on the most recent Mortgage that was taken out on this home.
Original Mortgage
$122,580
Outstanding Balance
$79,469
Interest Rate
4.94%
Mortgage Type
VA
Estimated Equity
$236,272
Purchase Details
Closed on
Aug 28, 2009
Sold by
Nieves Jose E and Morales Miriam
Bought by
Secretary Of Housing & Urban Development
Purchase Details
Closed on
Jun 2, 1999
Sold by
Anderson Homes Inc
Bought by
Nieves Jose E and Morales Miriam
Home Financials for this Owner
Home Financials are based on the most recent Mortgage that was taken out on this home.
Original Mortgage
$119,119
Interest Rate
7.27%
Create a Home Valuation Report for This Property
The Home Valuation Report is an in-depth analysis detailing your home's value as well as a comparison with similar homes in the area
Home Values in the Area
Average Home Value in this Area
Purchase History
| Date | Buyer | Sale Price | Title Company |
|---|---|---|---|
| Wilson Fredrick Jeuron | -- | None Available | |
| Secretary Of Housing & Urban Development | $126,242 | None Available | |
| Nieves Jose E | $119,500 | -- |
Source: Public Records
Mortgage History
| Date | Status | Borrower | Loan Amount |
|---|---|---|---|
| Open | Wilson Fredrick Jeuron | $122,580 | |
| Previous Owner | Nieves Jose E | $119,119 |
Source: Public Records
Tax History
| Year | Tax Paid | Tax Assessment Tax Assessment Total Assessment is a certain percentage of the fair market value that is determined by local assessors to be the total taxable value of land and additions on the property. | Land | Improvement |
|---|---|---|---|---|
| 2025 | $3,075 | $310,192 | $74,375 | $235,817 |
| 2024 | $2,229 | $159,800 | $35,610 | $124,190 |
| 2023 | $2,093 | $159,800 | $35,610 | $124,190 |
| 2022 | $2,045 | $159,800 | $35,610 | $124,190 |
| 2021 | $2,036 | $159,800 | $35,610 | $124,190 |
| 2020 | $1,988 | $159,800 | $35,610 | $124,190 |
| 2019 | $1,988 | $159,800 | $35,610 | $124,190 |
| 2018 | $1,808 | $133,305 | $29,675 | $103,630 |
| 2017 | $1,795 | $133,305 | $29,675 | $103,630 |
| 2016 | $1,734 | $133,305 | $29,675 | $103,630 |
| 2015 | $1,974 | $142,573 | $28,138 | $114,435 |
| 2014 | $1,974 | $142,573 | $28,138 | $114,435 |
Source: Public Records
Map
Nearby Homes
- 7 Duxford Ct
- 914 Flanders Dr
- 3900 Mary Martin Rd
- 3822 Mary Martin Rd
- 409 Magna Dr
- 5706 Wrenwood Ct Unit Lt 116
- 913 Valmet Dr
- 1060 Gentle Reed Dr
- 1050 Gentle Reed Dr
- 101 Coralbell Ct
- 509 Pebblestone Dr
- 1005 Sweet Cream Ct
- 5409 Hadrian Dr
- 4505 Tyne Dr
- 608 Chalcedony Ct
- 1113 Kindness Ln
- 15 N Indiancreek Place
- 1113 Homecoming Way
- 1025 Sweet Cream Ct
- 1143 Sweet Cream Ct
- 5 Tumlin Ct
- 208 Gladstone Dr
- 205 Gladstone Dr
- 307 Cloverdale Dr
- 7 Tumlin Ct
- 207 Gladstone Dr
- 210 Gladstone Dr
- 2 Tumlin Ct
- 4 Tumlin Ct
- 209 Gladstone Dr
- 6 Tumlin Ct
- 11 Tumlin Ct
- 211 Gladstone Dr
- 9 Tumlin Ct
- 102 Saddle Creek Ln
- 2 Ledgerock Way
- 104 Saddle Creek Ln
- 8 Tumlin Ct
- 115 Gladstone Dr
- 4 Ledgerock Way
Your Personal Tour Guide
Ask me questions while you tour the home.