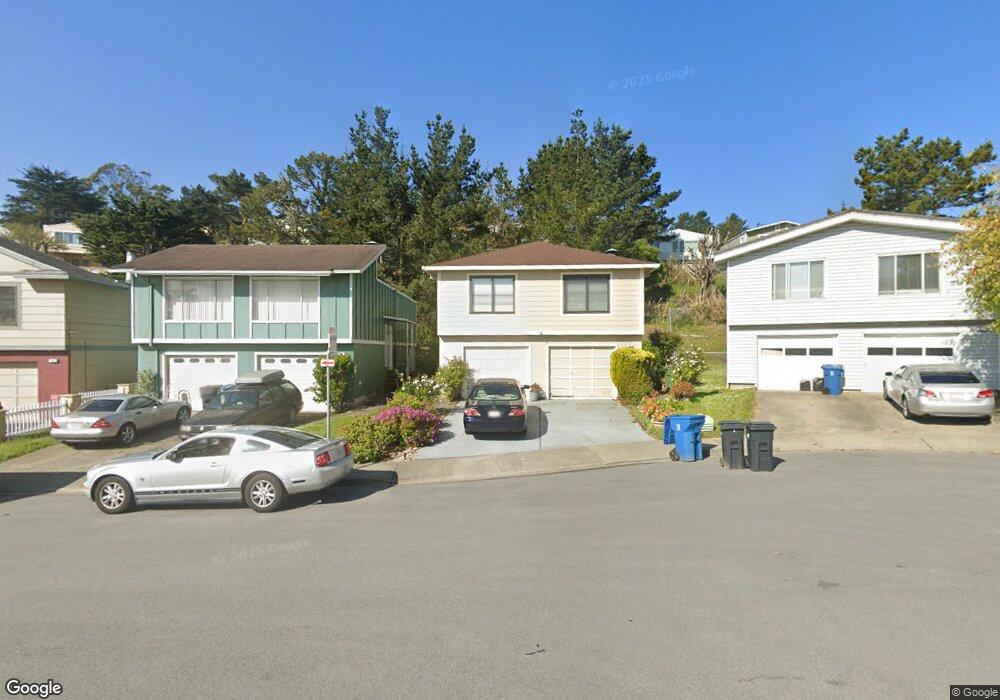
30 Heath Ct Daly City, CA 94015
Serramonte NeighborhoodEstimated Value: $1,214,000 - $1,411,000
3
Beds
3
Baths
1,240
Sq Ft
$1,040/Sq Ft
Est. Value
About This Home
This home is located at 30 Heath Ct, Daly City, CA 94015 and is currently estimated at $1,290,120, approximately $1,040 per square foot. 30 Heath Ct is a home located in San Mateo County with nearby schools including Junipero Serra Elementary School, Alta Loma Middle School, and El Camino High School.
Ownership History
Date
Name
Owned For
Owner Type
Purchase Details
Closed on
May 22, 2019
Sold by
Devi Charan Premila
Bought by
Charon Premila Devi
Current Estimated Value
Home Financials for this Owner
Home Financials are based on the most recent Mortgage that was taken out on this home.
Original Mortgage
$547,000
Outstanding Balance
$479,947
Interest Rate
4.1%
Mortgage Type
New Conventional
Estimated Equity
$810,173
Purchase Details
Closed on
Dec 8, 2014
Sold by
Charan Premilla Devi and Charan Premila Devi
Bought by
Charan Premilla Devi
Home Financials for this Owner
Home Financials are based on the most recent Mortgage that was taken out on this home.
Original Mortgage
$443,000
Interest Rate
3.95%
Mortgage Type
New Conventional
Purchase Details
Closed on
Feb 21, 2009
Sold by
Charan Kanchan Kishore and Charan Kanchan K
Bought by
Charan Premila Devi
Create a Home Valuation Report for This Property
The Home Valuation Report is an in-depth analysis detailing your home's value as well as a comparison with similar homes in the area
Home Values in the Area
Average Home Value in this Area
Purchase History
| Date | Buyer | Sale Price | Title Company |
|---|---|---|---|
| Charon Premila Devi | -- | First American Title Company | |
| Charan Premilla Devi | -- | First American Title | |
| Charan Premila Devi | -- | None Available |
Source: Public Records
Mortgage History
| Date | Status | Borrower | Loan Amount |
|---|---|---|---|
| Open | Charon Premila Devi | $547,000 | |
| Previous Owner | Charan Premilla Devi | $443,000 |
Source: Public Records
Tax History Compared to Growth
Tax History
| Year | Tax Paid | Tax Assessment Tax Assessment Total Assessment is a certain percentage of the fair market value that is determined by local assessors to be the total taxable value of land and additions on the property. | Land | Improvement |
|---|---|---|---|---|
| 2025 | $5,634 | $468,058 | $234,029 | $234,029 |
| 2023 | $5,634 | $449,886 | $224,943 | $224,943 |
| 2022 | $5,059 | $441,066 | $220,533 | $220,533 |
| 2021 | $4,970 | $432,418 | $216,209 | $216,209 |
| 2020 | $5,041 | $427,986 | $213,993 | $213,993 |
| 2019 | $5,082 | $419,596 | $209,798 | $209,798 |
| 2018 | $5,022 | $411,370 | $205,685 | $205,685 |
| 2017 | $4,936 | $403,304 | $201,652 | $201,652 |
| 2016 | $4,554 | $395,398 | $197,699 | $197,699 |
| 2015 | $4,579 | $389,460 | $194,730 | $194,730 |
| 2014 | $4,665 | $381,832 | $190,916 | $190,916 |
Source: Public Records
Map
Nearby Homes
- 130 Morton Dr
- 16 Canterbury Ave
- 391 Imperial Dr
- 130 Marbly Ave
- 5 Bacon Ct
- 109 Lycett Cir
- 303 Innisfree Dr Unit 2
- 618 Foothill Dr
- 656 Forest Lake Dr
- 318 Innisfree Dr Unit 75
- 286 Barbara Ln
- 289 Barbara Ln
- 227 Gateway Dr
- 265 Crestmoor Cir
- 226 Crestmoor Cir
- 166 Crestmoor Cir
- 3855 Carter Dr Unit 101
- 3885 Carter Dr Unit 307
- 376 Imperial Way Unit 315
- 391 Mandarin Dr Unit 208