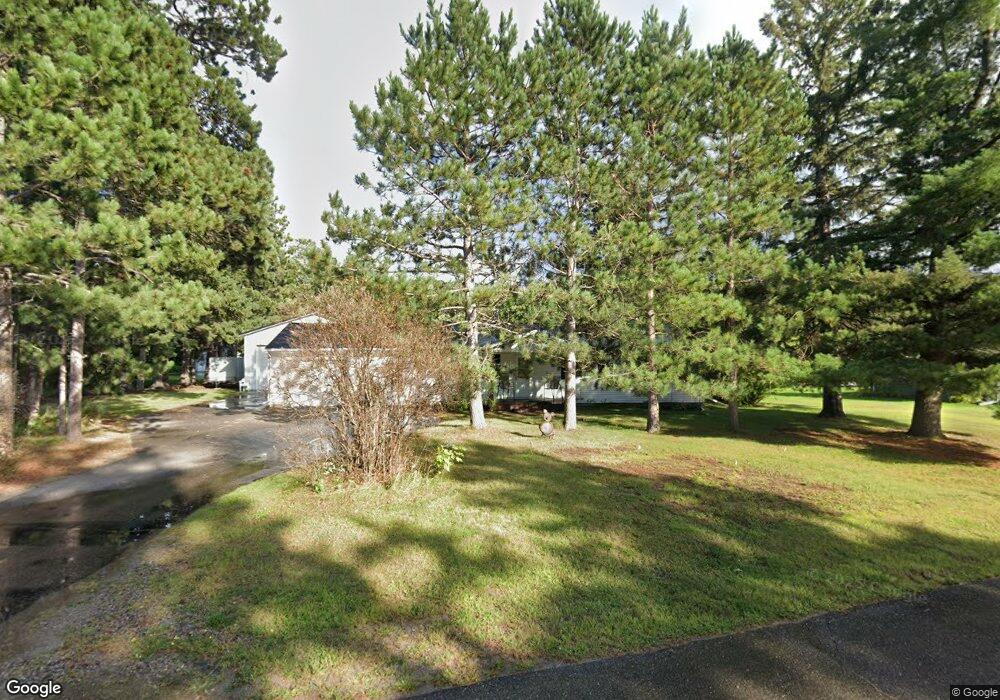
300 3rd St S Hackensack, MN 56452
Estimated Value: $121,000 - $247,000
2
Beds
1
Bath
904
Sq Ft
$180/Sq Ft
Est. Value
About This Home
This home is located at 300 3rd St S, Hackensack, MN 56452 and is currently estimated at $163,062, approximately $180 per square foot. 300 3rd St S is a home located in Cass County with nearby schools including WHA Elementary School and Walker Hackensack Akeley High School.
Ownership History
Date
Name
Owned For
Owner Type
Purchase Details
Closed on
Dec 17, 2021
Sold by
Bi County Cmnty Actio Inc
Bought by
Brady Alice
Current Estimated Value
Home Financials for this Owner
Home Financials are based on the most recent Mortgage that was taken out on this home.
Original Mortgage
$85,500
Outstanding Balance
$78,616
Interest Rate
3.09%
Mortgage Type
Purchase Money Mortgage
Estimated Equity
$84,446
Purchase Details
Closed on
Jan 10, 2007
Sold by
Treague Erica Tish
Bought by
Bi County Community Action Programs Inc
Purchase Details
Closed on
Apr 19, 2006
Sold by
Bi County Community Action Program Inc
Bought by
Treague Erica Tish
Purchase Details
Closed on
Nov 23, 2005
Sold by
Harkness Rex M
Bought by
Bi County Community Action Programs Inc
Purchase Details
Closed on
Feb 3, 2004
Sold by
Bi County Community Action Programs Inc
Bought by
Hookom Alan
Create a Home Valuation Report for This Property
The Home Valuation Report is an in-depth analysis detailing your home's value as well as a comparison with similar homes in the area
Purchase History
| Date | Buyer | Sale Price | Title Company |
|---|---|---|---|
| Brady Alice | $95,000 | None Available | |
| Bi County Community Action Programs Inc | -- | None Available | |
| Treague Erica Tish | $91,000 | None Available | |
| Bi County Community Action Programs Inc | -- | None Available | |
| Hookom Alan | $96,100 | None Available |
Source: Public Records
Mortgage History
| Date | Status | Borrower | Loan Amount |
|---|---|---|---|
| Open | Brady Alice | $85,500 | |
| Closed | Hookom Alan | $0 |
Source: Public Records
Tax History
| Year | Tax Paid | Tax Assessment Tax Assessment Total Assessment is a certain percentage of the fair market value that is determined by local assessors to be the total taxable value of land and additions on the property. | Land | Improvement |
|---|---|---|---|---|
| 2024 | $844 | $92,500 | $4,000 | $88,500 |
| 2023 | $812 | $93,300 | $4,000 | $89,300 |
| 2022 | $694 | $93,300 | $4,000 | $89,300 |
| 2021 | $734 | $61,800 | $4,000 | $57,800 |
| 2020 | $732 | $65,900 | $4,000 | $61,900 |
| 2019 | $650 | $57,100 | $4,000 | $53,100 |
| 2018 | $560 | $47,400 | $4,000 | $43,400 |
| 2017 | $650 | $47,400 | $4,000 | $43,400 |
| 2016 | $390 | $0 | $0 | $0 |
| 2015 | $390 | $56,500 | $4,000 | $52,500 |
| 2014 | $394 | $0 | $0 | $0 |
Source: Public Records
Map
Nearby Homes
- 230 Whipple Ave E
- 136 1st St N
- 209 Lakeshore Dr W
- 209 Park Ave W
- TBD NW Miller Bay Ln
- 5159 Rocky Ridge Rd NW
- TBD Kestrel Trail NW
- 3174 County 5 NW
- 4055 Forseman Point Dr NW
- 4059 Hiram Township 9
- 5568 50th St NW
- 1353 State 371 NW
- 1489 Gateway Dr NW
- 3403 68th Ave NW
- 1287 Trinity Pines Ln NW
- 2170 County Road 5 NW
- TBD - Parcel A Ticonderoga Trail
- TBD - Parcel B Ticonderoga Trail
- TBD - Tract 3 Ticonderoga Trail
- TBD - Tract 2 Ticonderoga Trail
- 300 3rd St S
- 304 3rd St S
- 308 3rd St S
- 305 3rd St S
- 312 3rd St S
- 218 State 371 S
- 205 3rd St S
- 310 Waggoner Ave E
- 312 312 3rd St-Loop-
- 312 312 3rd St Loop
- 312 312 Third St Loop
- 312 3rd St
- XXX State 371 S
- TBD State 371 S
- 320 Wagonner Ave
- 201 3rd St S
- 301 301 S 3rd St
- 301 3rd St S
- 324 Waggoner Ave E
- 316 State 371 S
Your Personal Tour Guide
Ask me questions while you tour the home.