Estimated Value: $597,000 - $768,558
5
Beds
3
Baths
2,992
Sq Ft
$220/Sq Ft
Est. Value
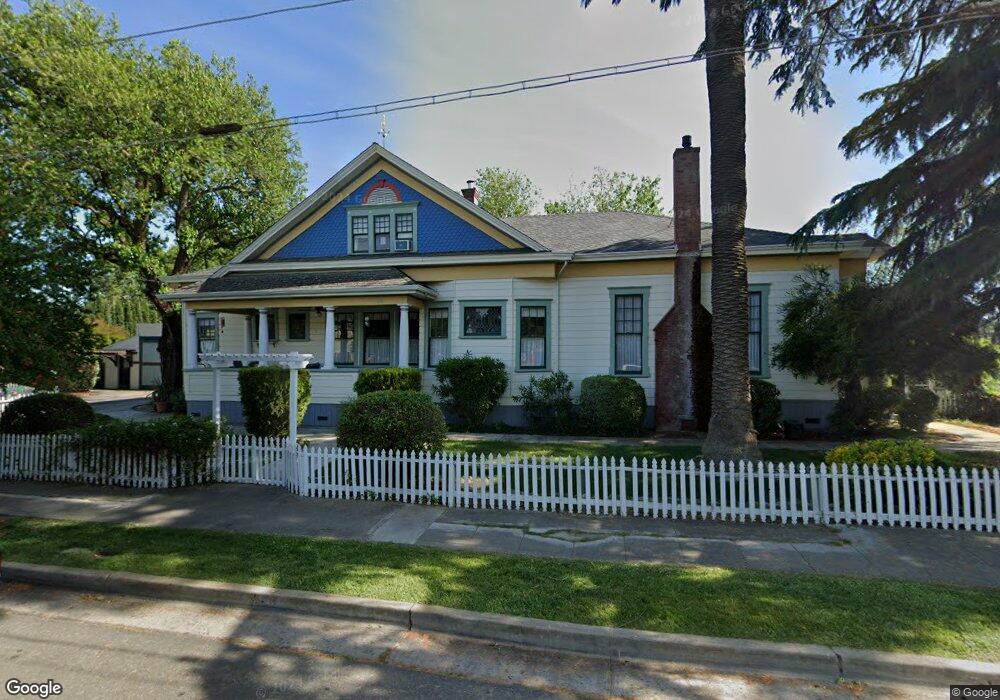
About This Home
This home is located at 300 E B St, Dixon, CA 95620 and is currently estimated at $657,890, approximately $219 per square foot. 300 E B St is a home located in Solano County with nearby schools including Anderson (Linford L.) Elementary School, Dixon High School, and Dixon Montessori Charter.
Ownership History
Date
Name
Owned For
Owner Type
Purchase Details
Closed on
Jun 3, 2009
Sold by
Werrin David Rand and Werrin Susan Broadhurst
Bought by
Werrin David Rand and Werrin Susan Broadhurst
Current Estimated Value
Home Financials for this Owner
Home Financials are based on the most recent Mortgage that was taken out on this home.
Original Mortgage
$161,800
Outstanding Balance
$102,172
Interest Rate
4.76%
Mortgage Type
New Conventional
Estimated Equity
$555,718
Purchase Details
Closed on
Apr 16, 2005
Sold by
Werrin David Rand and Broadhurst Werrin Susan
Bought by
Werrin David Rand and Werrin Susan Broadhurst
Purchase Details
Closed on
Dec 16, 1996
Sold by
Tavey Bruce D and Tavey Verlen L
Bought by
Werrin David Rand and Broadhurst Werrin Susan
Home Financials for this Owner
Home Financials are based on the most recent Mortgage that was taken out on this home.
Original Mortgage
$145,000
Interest Rate
7.67%
Create a Home Valuation Report for This Property
The Home Valuation Report is an in-depth analysis detailing your home's value as well as a comparison with similar homes in the area
Home Values in the Area
Average Home Value in this Area
Purchase History
| Date | Buyer | Sale Price | Title Company |
|---|---|---|---|
| Werrin David Rand | -- | Fidelity National Title Co | |
| Werrin David Rand | -- | Fidelity National Title Co | |
| Werrin David Rand | -- | -- | |
| Werrin David Rand | $272,000 | First American Title Guarant |
Source: Public Records
Mortgage History
| Date | Status | Borrower | Loan Amount |
|---|---|---|---|
| Open | Werrin David Rand | $161,800 | |
| Closed | Werrin David Rand | $145,000 |
Source: Public Records
Tax History
| Year | Tax Paid | Tax Assessment Tax Assessment Total Assessment is a certain percentage of the fair market value that is determined by local assessors to be the total taxable value of land and additions on the property. | Land | Improvement |
|---|---|---|---|---|
| 2025 | $4,832 | $443,001 | $81,432 | $361,569 |
| 2024 | $4,832 | $434,316 | $79,836 | $354,480 |
| 2023 | $4,687 | $425,801 | $78,271 | $347,530 |
| 2022 | $4,618 | $417,453 | $76,737 | $340,716 |
| 2021 | $4,560 | $409,269 | $75,233 | $334,036 |
| 2020 | $4,485 | $405,073 | $74,462 | $330,611 |
| 2019 | $4,400 | $397,131 | $73,002 | $324,129 |
| 2018 | $4,382 | $389,345 | $71,571 | $317,774 |
| 2017 | $4,271 | $381,712 | $70,168 | $311,544 |
| 2016 | $4,084 | $374,229 | $68,793 | $305,436 |
| 2015 | $3,989 | $368,609 | $67,760 | $300,849 |
| 2014 | $3,947 | $361,389 | $66,433 | $294,956 |
Source: Public Records
Map
Nearby Homes
Your Personal Tour Guide
Ask me questions while you tour the home.