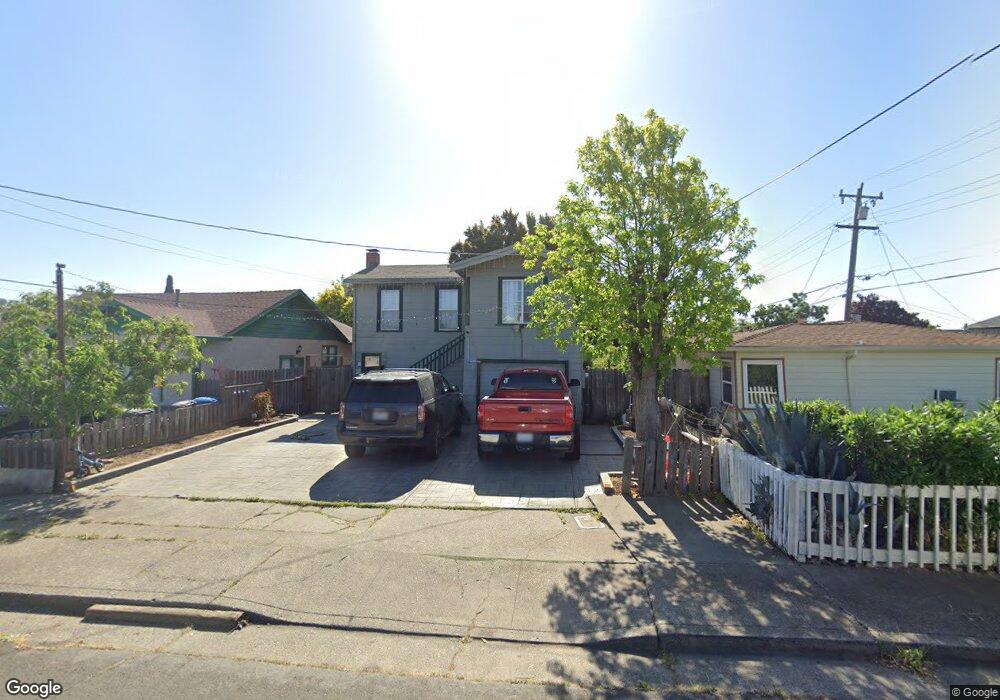
300 Evans Ave Vallejo, CA 94590
West Vallejo NeighborhoodEstimated Value: $402,000 - $463,000
3
Beds
3
Baths
1,084
Sq Ft
$393/Sq Ft
Est. Value
About This Home
This home is located at 300 Evans Ave, Vallejo, CA 94590 and is currently estimated at $426,333, approximately $393 per square foot. 300 Evans Ave is a home located in Solano County with nearby schools including Grace Patterson Elementary School, Vallejo High School, and Mustard Seed Preschool and Kindergarten.
Ownership History
Date
Name
Owned For
Owner Type
Purchase Details
Closed on
Nov 12, 1999
Sold by
Pawluk Jill A
Bought by
Caro Wenceslao and Caro Beatriz
Current Estimated Value
Home Financials for this Owner
Home Financials are based on the most recent Mortgage that was taken out on this home.
Original Mortgage
$115,822
Outstanding Balance
$35,603
Interest Rate
7.84%
Mortgage Type
FHA
Estimated Equity
$390,730
Purchase Details
Closed on
Jun 16, 1997
Sold by
Nobriga Robert M and Ann Jill
Bought by
Pawluk Jill A
Create a Home Valuation Report for This Property
The Home Valuation Report is an in-depth analysis detailing your home's value as well as a comparison with similar homes in the area
Home Values in the Area
Average Home Value in this Area
Purchase History
| Date | Buyer | Sale Price | Title Company |
|---|---|---|---|
| Caro Wenceslao | $116,000 | Fidelity National Title Co | |
| Pawluk Jill A | -- | -- |
Source: Public Records
Mortgage History
| Date | Status | Borrower | Loan Amount |
|---|---|---|---|
| Open | Caro Wenceslao | $115,822 |
Source: Public Records
Tax History
| Year | Tax Paid | Tax Assessment Tax Assessment Total Assessment is a certain percentage of the fair market value that is determined by local assessors to be the total taxable value of land and additions on the property. | Land | Improvement |
|---|---|---|---|---|
| 2025 | $3,027 | $178,280 | $38,419 | $139,861 |
| 2024 | $3,027 | $174,785 | $37,666 | $137,119 |
| 2023 | $2,819 | $171,359 | $36,928 | $134,431 |
| 2022 | $2,713 | $168,000 | $36,204 | $131,796 |
| 2021 | $2,650 | $164,707 | $35,495 | $129,212 |
| 2020 | $2,646 | $163,020 | $35,132 | $127,888 |
| 2019 | $2,549 | $159,825 | $34,444 | $125,381 |
| 2018 | $2,375 | $156,692 | $33,769 | $122,923 |
| 2017 | $2,253 | $153,620 | $33,107 | $120,513 |
| 2016 | $1,681 | $150,608 | $32,458 | $118,150 |
| 2015 | $1,658 | $148,347 | $31,971 | $116,376 |
| 2014 | $1,634 | $145,442 | $31,345 | $114,097 |
Source: Public Records
Map
Nearby Homes
- 315 Evans Ave
- 227 Evans Ave
- 321 Benicia Rd
- 1434 Beach St
- 401 Central Ave
- 312 Central Ave
- 47 Muller St
- 1425 Gordon St
- 4 Woodrow Ave
- 128 Tuolumne St
- 2019 Georgia St
- 37 14th St
- 214 12th St
- 410 San Gabriel Dr Unit 410
- 215 Roney Ave
- 314 San Marcus Dr
- 313 Roney Ave
- 506 Steffan St
- 139 Laurel St
- 435 Grant St
- 310 Evans Ave
- 320 Evans Ave
- 322 Evans Ave
- 209 Thomas Ave
- 209 Sperry Ave
- 225 Sperry Ave
- 201 Sperry Ave
- 244 Evans Ave
- 324 Evans Ave
- 229 Sperry Ave
- 307 Evans Ave
- 301 Evans Ave
- 311 Evans Ave
- 233 Benicia Rd Unit A,B,C
- 233 Benicia Rd
- 243 Benicia Rd
- 238 Evans Ave
- 143 Sperry Ave
- 237 Evans Ave
- 241 Benicia Rd
Your Personal Tour Guide
Ask me questions while you tour the home.