Estimated Value: $359,000 - $414,000
3
Beds
2
Baths
1,688
Sq Ft
$229/Sq Ft
Est. Value
About This Home
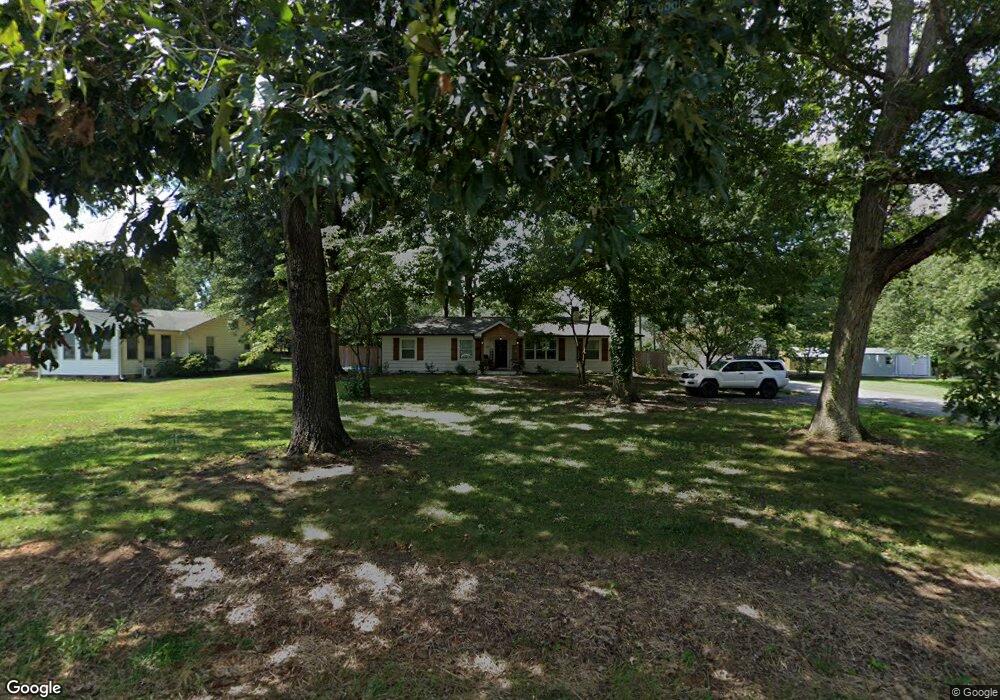
This home is located at 300 Waymon Dr, Greer, SC 29651 and is currently estimated at $386,474, approximately $228 per square foot. 300 Waymon Dr is a home located in Greenville County with nearby schools including Woodland Elementary School, Greer Middle School, and Greer High School.
Ownership History
Date
Name
Owned For
Owner Type
Purchase Details
Closed on
Oct 8, 2020
Sold by
Greene Benjamin
Bought by
Horton Laura B
Current Estimated Value
Home Financials for this Owner
Home Financials are based on the most recent Mortgage that was taken out on this home.
Original Mortgage
$274,829
Outstanding Balance
$242,225
Interest Rate
2.9%
Mortgage Type
FHA
Estimated Equity
$144,249
Purchase Details
Closed on
Mar 5, 2020
Sold by
Us Bank National Assciation
Bought by
Greene Benjamin
Purchase Details
Closed on
Dec 17, 2019
Sold by
Hoffman Robert E and Hoffman Sara L
Bought by
U S Bank National Association and Rmac Trust
Purchase Details
Closed on
Jul 13, 2015
Sold by
Hoffman Robert E and Case #2015-Dr-23-1682
Bought by
Hoffman Sara L
Purchase Details
Closed on
Jul 3, 2000
Sold by
Jenkins W E
Bought by
Hoffman Robert E
Purchase Details
Closed on
Jun 29, 2000
Sold by
Rocky Creek Lp
Bought by
Lazarus Shouse Communities
Create a Home Valuation Report for This Property
The Home Valuation Report is an in-depth analysis detailing your home's value as well as a comparison with similar homes in the area
Home Values in the Area
Average Home Value in this Area
Purchase History
| Date | Buyer | Sale Price | Title Company |
|---|---|---|---|
| Horton Laura B | $279,900 | None Available | |
| Greene Benjamin | $93,500 | None Available | |
| U S Bank National Association | $112,864 | None Available | |
| Hoffman Sara L | -- | -- | |
| Hoffman Robert E | $103,500 | -- | |
| Lazarus Shouse Communities | $65,500 | -- |
Source: Public Records
Mortgage History
| Date | Status | Borrower | Loan Amount |
|---|---|---|---|
| Open | Horton Laura B | $274,829 |
Source: Public Records
Tax History
| Year | Tax Paid | Tax Assessment Tax Assessment Total Assessment is a certain percentage of the fair market value that is determined by local assessors to be the total taxable value of land and additions on the property. | Land | Improvement |
|---|---|---|---|---|
| 2025 | $1,883 | $13,930 | $1,940 | $11,990 |
| 2024 | $1,883 | $12,120 | $960 | $11,160 |
| 2023 | $1,798 | $12,120 | $960 | $11,160 |
| 2022 | $5,285 | $18,180 | $1,440 | $16,740 |
| 2021 | $4,483 | $15,700 | $1,440 | $14,260 |
| 2020 | $581 | $3,680 | $960 | $2,720 |
| 2019 | $581 | $3,680 | $960 | $2,720 |
| 2018 | $580 | $3,680 | $960 | $2,720 |
| 2017 | $576 | $3,680 | $960 | $2,720 |
| 2016 | $1,559 | $92,030 | $24,000 | $68,030 |
| 2015 | $261 | $92,030 | $24,000 | $68,030 |
| 2014 | $371 | $116,580 | $24,000 | $92,580 |
Source: Public Records
Map
Nearby Homes
- 113 Buddy Ave
- 109 Buddy Ave
- 1025 S Buncombe Rd
- 101 Benjamin Ave
- 220 Pleasant Dr
- 215 Wrightwood Ln
- 202 Roscoe Dr
- 107 Coogan Ln
- 304 Hickory Rock Ln
- 704 Paxton Rose Dr
- 265 Reese Ave
- 7 Country Dale Dr
- 131 A Dillard Dr
- 402 Teresa Gem Ln
- 912 S Main St
- 130 Marthawood Ln
- 569 Yellow Fox Rd
- 420 Yellow Fox Rd
- 572 Yellow Fox Rd
- 347 Sudduth Farms Dr
Your Personal Tour Guide
Ask me questions while you tour the home.