Estimated Value: $88,441 - $177,000
--
Bed
--
Bath
--
Sq Ft
0.34
Acres
About This Home
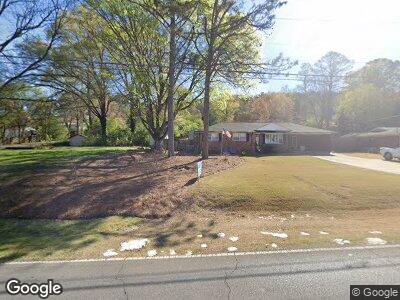
This home is located at 3001 Maple Rd SE, Rome, GA 30161 and is currently estimated at $122,480. 3001 Maple Rd SE is a home located in Floyd County with nearby schools including Pepperell Middle School, Pepperell High School, and Montessori School of Rome.
Ownership History
Date
Name
Owned For
Owner Type
Purchase Details
Closed on
Aug 24, 2015
Sold by
Henderson Barry
Bought by
H Investments Llc
Current Estimated Value
Home Financials for this Owner
Home Financials are based on the most recent Mortgage that was taken out on this home.
Original Mortgage
$555,411
Outstanding Balance
$450,081
Interest Rate
3.89%
Mortgage Type
New Conventional
Purchase Details
Closed on
Oct 14, 2014
Sold by
Henderson Joe Paul
Bought by
Henderson Barry
Purchase Details
Closed on
Oct 22, 2009
Sold by
Vines Robert H
Bought by
Henderson Barry R
Purchase Details
Closed on
Jun 26, 2003
Sold by
Henderson Ii Joe Paul and Barry Ralph Hend
Bought by
Vines Robert H and Carla Vines
Purchase Details
Closed on
May 24, 1999
Sold by
Henderson Edna G
Bought by
Henderson Ii Joe Paul and Barry Ralph
Purchase Details
Closed on
Jan 1, 1962
Bought by
Henderson Edna G
Create a Home Valuation Report for This Property
The Home Valuation Report is an in-depth analysis detailing your home's value as well as a comparison with similar homes in the area
Home Values in the Area
Average Home Value in this Area
Purchase History
| Date | Buyer | Sale Price | Title Company |
|---|---|---|---|
| H Investments Llc | -- | -- | |
| Henderson Barry | -- | -- | |
| Henderson Barry R | $15,000 | -- | |
| Vines Robert H | $56,400 | -- | |
| Henderson Ii Joe Paul | -- | -- | |
| Henderson Edna G | -- | -- |
Source: Public Records
Mortgage History
| Date | Status | Borrower | Loan Amount |
|---|---|---|---|
| Closed | H Investments Llc | $555,411 | |
| Previous Owner | Vines Robert H | $117,000 | |
| Previous Owner | Vines Robert H | $94,500 |
Source: Public Records
Tax History Compared to Growth
Tax History
| Year | Tax Paid | Tax Assessment Tax Assessment Total Assessment is a certain percentage of the fair market value that is determined by local assessors to be the total taxable value of land and additions on the property. | Land | Improvement |
|---|---|---|---|---|
| 2024 | $363 | $9,378 | $8,624 | $754 |
| 2023 | $363 | $8,573 | $7,840 | $733 |
| 2022 | $304 | $7,027 | $6,272 | $755 |
| 2021 | $302 | $6,938 | $6,272 | $666 |
| 2020 | $253 | $5,389 | $4,704 | $685 |
| 2019 | $245 | $5,407 | $4,704 | $703 |
| 2018 | $243 | $5,425 | $4,704 | $721 |
| 2017 | $244 | $5,444 | $4,704 | $740 |
| 2016 | $247 | $5,440 | $4,680 | $760 |
| 2015 | $245 | $5,440 | $4,680 | $760 |
| 2014 | $245 | $5,440 | $4,680 | $760 |
Source: Public Records
Map
Nearby Homes
- 409 Flora Ave SE
- 571 Old Lindale Rd SE
- 226 Flora Ave SE
- 2700 Maple Rd SE
- 215 Alfred Ave SE
- 211 Alfred Ave SE
- 33 Summit Dr
- 35 Saddle Mountain Rd SE
- 12 Azalea St SE
- 117 Hawthorne St SE
- 313 Chateau Dr SE
- 107 E Linden St SE
- 2 Saddlebrook Dr SE
- 19 Saddlebrook Dr SE
- 114 Holly St SE
- 280 Ravenwood Dr SE
- 0 Martha Berry Hwy Unit 7525627
- 3 Sundance Dr SE
- 3001 Maple Rd SE
- 3003 Maple Rd SE
- 0 Maple Rd SE
- 2921 Maple Rd SE
- 400 Flora Ave Extension SE
- 400 Flora Ave Extension SE
- 402 Flora Ave Extension SE
- 3005 Maple Rd SE
- 2919 Maple Rd SE
- 340 Flora Ave SE
- 413 Flora Ave SE
- 419 Flora Ave SE
- 3002 Maple Rd SE
- 2922 Maple Rd SE
- 338 Flora Ave SE
- 2917 Maple Rd SE
- 3007 Maple Rd SE
- 404 Flora Ave Extension SE
- 404 Flora Ave Extension SE
- 404 Flora Ave SE