Estimated Value: $393,391 - $634,000
3
Beds
2
Baths
2,200
Sq Ft
$218/Sq Ft
Est. Value
About This Home
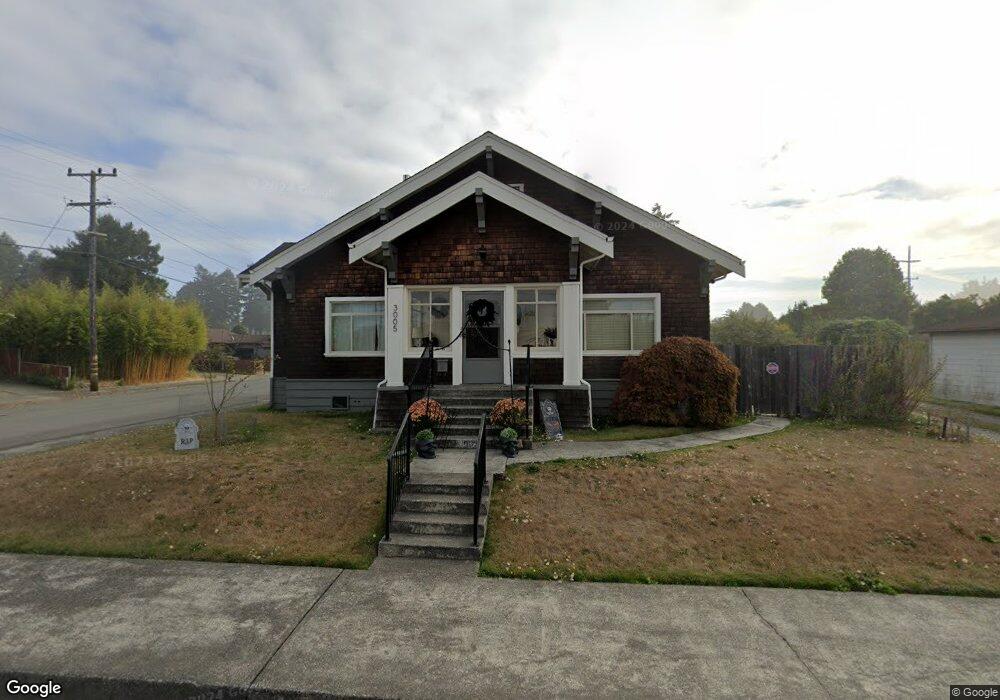
This home is located at 3005 Q St, Eureka, CA 95501 and is currently estimated at $479,348, approximately $217 per square foot. 3005 Q St is a home located in Humboldt County with nearby schools including Washington Elementary School, Catherine L. Zane Middle School, and Eureka Senior High School.
Ownership History
Date
Name
Owned For
Owner Type
Purchase Details
Closed on
Jul 30, 2019
Sold by
Pastori James M
Bought by
Pastori James M
Current Estimated Value
Home Financials for this Owner
Home Financials are based on the most recent Mortgage that was taken out on this home.
Original Mortgage
$136,000
Outstanding Balance
$118,892
Interest Rate
3.82%
Mortgage Type
New Conventional
Estimated Equity
$360,456
Purchase Details
Closed on
May 26, 2015
Sold by
Katri Dennis P and Rice Todd
Bought by
Pastori James M and Rice Hayley
Home Financials for this Owner
Home Financials are based on the most recent Mortgage that was taken out on this home.
Original Mortgage
$190,400
Interest Rate
3.64%
Mortgage Type
New Conventional
Create a Home Valuation Report for This Property
The Home Valuation Report is an in-depth analysis detailing your home's value as well as a comparison with similar homes in the area
Home Values in the Area
Average Home Value in this Area
Purchase History
| Date | Buyer | Sale Price | Title Company |
|---|---|---|---|
| Pastori James M | -- | Humboldt Land Title | |
| Pastori James M | $238,000 | Humboldt Land Title Company |
Source: Public Records
Mortgage History
| Date | Status | Borrower | Loan Amount |
|---|---|---|---|
| Open | Pastori James M | $136,000 | |
| Previous Owner | Pastori James M | $190,400 |
Source: Public Records
Tax History
| Year | Tax Paid | Tax Assessment Tax Assessment Total Assessment is a certain percentage of the fair market value that is determined by local assessors to be the total taxable value of land and additions on the property. | Land | Improvement |
|---|---|---|---|---|
| 2025 | $2,524 | $252,518 | $94,681 | $157,837 |
| 2024 | $2,524 | $247,568 | $92,825 | $154,743 |
| 2023 | $2,487 | $242,714 | $91,005 | $151,709 |
| 2022 | $2,580 | $237,956 | $89,221 | $148,735 |
| 2021 | $2,415 | $233,291 | $87,472 | $145,819 |
| 2020 | $2,396 | $230,900 | $86,576 | $144,324 |
| 2019 | $2,345 | $226,374 | $84,879 | $141,495 |
| 2018 | $2,308 | $221,936 | $83,215 | $138,721 |
| 2017 | $2,295 | $217,585 | $81,584 | $136,001 |
| 2016 | $2,294 | $213,320 | $79,985 | $133,335 |
| 2015 | $490 | $50,833 | $16,541 | $34,292 |
| 2014 | $457 | $49,838 | $16,217 | $33,621 |
Source: Public Records
Map
Nearby Homes
Your Personal Tour Guide
Ask me questions while you tour the home.