
Landlord's Agent in 2017
Moin Haque
Coldwell Banker Realty
(630) 518-0806
12 in this area
236 Total Sales


Estimated Value: $398,838 - $442,000
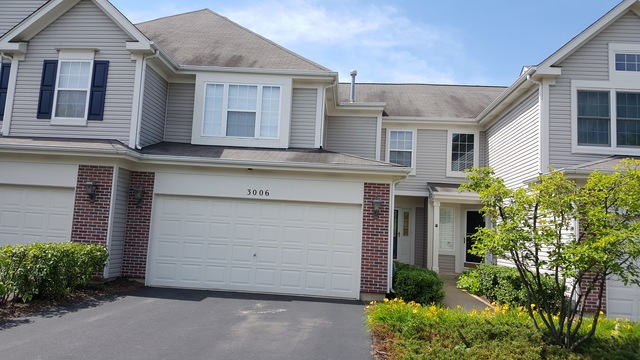
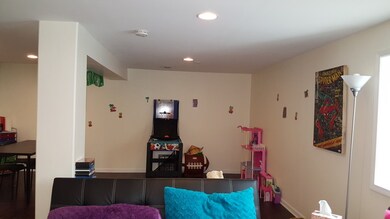
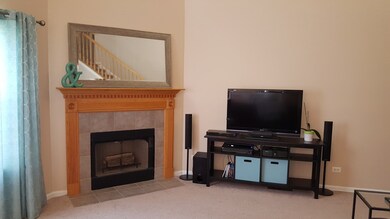
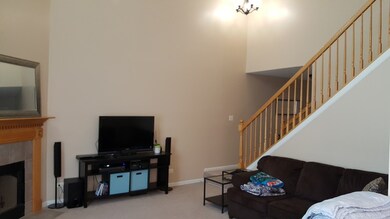
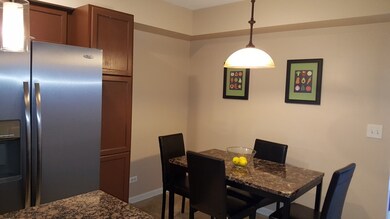
204 Naperville School Dist. Move right in to this freshly painted and carpeted 3 bedroom 2.5 bath with full finished basement townhouse. The 2 car garage is attached and the full size laundry room is conveniently located on the second floor. Convenient to shops and restaurants. Come with full SS kitchen appliances,Granite tops, Island, Ceramic tiles and many more. Closed to shopping, transportation and highway. Tenant occupied and will be available from August 1st or sooner.
Last Agent to Rent the Property
Coldwell Banker Realty License #471011151 Listed on: 06/13/2017
Last Renter's Agent
Shaheera Ahmad
HomeSmart Realty Group License #475131454
| Date | Buyer | Sale Price | Title Company |
|---|---|---|---|
| Khan Muhammad K | $185,000 | Attorneys Title Guaranty Fun | |
| Mclean Scott S | $177,000 | Chicago Title Insurance Co |
| Date | Status | Borrower | Loan Amount |
|---|---|---|---|
| Open | Khan Muhammad K | $181,649 | |
| Previous Owner | Mclean Scott S | $138,000 |
| Date | Event | Price | List to Sale | Price per Sq Ft | Prior Sale |
|---|---|---|---|---|---|
| 07/01/2017 07/01/17 | Rented | $2,000 | 0.0% | -- | |
| 06/15/2017 06/15/17 | For Rent | $2,000 | 0.0% | -- | |
| 06/14/2017 06/14/17 | Off Market | $2,000 | -- | -- | |
| 06/13/2017 06/13/17 | For Rent | $2,000 | +0.3% | -- | |
| 06/27/2016 06/27/16 | Rented | $1,995 | 0.0% | -- | |
| 06/21/2016 06/21/16 | For Rent | $1,995 | 0.0% | -- | |
| 03/28/2013 03/28/13 | Sold | $185,000 | -7.5% | -- | View Prior Sale |
| 02/22/2013 02/22/13 | Pending | -- | -- | -- | |
| 02/09/2013 02/09/13 | For Sale | $199,900 | -- | -- |
| Year | Tax Paid | Tax Assessment Tax Assessment Total Assessment is a certain percentage of the fair market value that is determined by local assessors to be the total taxable value of land and additions on the property. | Land | Improvement |
|---|---|---|---|---|
| 2024 | $6,515 | $107,473 | $31,481 | $75,992 |
| 2023 | $6,515 | $94,941 | $27,810 | $67,131 |
| 2022 | $6,179 | $86,617 | $26,308 | $60,309 |
| 2021 | $5,572 | $82,492 | $25,055 | $57,437 |
| 2020 | $5,462 | $81,185 | $24,658 | $56,527 |
| 2019 | $5,362 | $78,897 | $23,963 | $54,934 |
| 2018 | $5,133 | $74,528 | $23,435 | $51,093 |
| 2017 | $5,049 | $72,604 | $22,830 | $49,774 |
| 2016 | $5,034 | $71,042 | $22,339 | $48,703 |
| 2015 | $4,965 | $68,310 | $21,480 | $46,830 |
| 2014 | $4,965 | $65,372 | $21,480 | $43,892 |
| 2013 | $4,965 | $65,372 | $21,480 | $43,892 |
Landlord's Agent in 2017
Moin Haque
Coldwell Banker Realty
(630) 518-0806
12 in this area
236 Total Sales
S
Tenant's Agent in 2017
Shaheera Ahmad
HomeSmart Realty Group
T
Buyer's Agent in 2016
Talat Arain
Coldwell Banker Realty
(630) 643-1818
35 Total Sales
J
Seller's Agent in 2013
Judith Sampey-Mueller
Buyer's Agent in 2013
Shaun Jurczewski
HomeSmart Connect LLC
(630) 440-7355
89 Total Sales
Source: Midwest Real Estate Data (MRED)
MLS Number: MRD09657314
APN: 07-01-09-202-007
Disclaimer: Certain information contained herein is derived from information provided by parties other than Homes.com. All information provided is deemed reliable, but is not guaranteed to be accurate and should be independently verified.
![]() Based on information submitted to the MLS GRID. All data is obtained from various sources and may not have been verified by broker or MLS GRID. Supplied Open House Information is subject to change without notice. All information should be independently reviewed and verified for accuracy. Properties may or may not be listed by the office/agent presenting the information. Some IDX listings have been excluded from this website.
Based on information submitted to the MLS GRID. All data is obtained from various sources and may not have been verified by broker or MLS GRID. Supplied Open House Information is subject to change without notice. All information should be independently reviewed and verified for accuracy. Properties may or may not be listed by the office/agent presenting the information. Some IDX listings have been excluded from this website.
The Digital Millennium Copyright Act of 1998, 17 U.S.C. § 512 (the “DMCA”) provides recourse for copyright owners who believe that material appearing on the Internet infringes their rights under U.S. copyright law. If you believe in good faith that any content or material made available in connection with our website or services infringes your copyright, you (or your agent) may send us a notice requesting that the content or material be removed, or access to it blocked.
Notices must be sent in writing by email to DMCAnotice@MLSGrid.com.
The DMCA requires that your notice of alleged copyright infringement include the following information:
(1) description of the copyrighted work that is the subject of claimed infringement;
(2) description of the alleged infringing content and information sufficient to permit us to locate the content;
(3) contact information for you, including your address, telephone number and email address;
(4) a statement by you that you have a good faith belief that the content in the manner complained of is not authorized by the copyright owner, or its agent, or by the operation of any law;
(5) a statement by you, signed under penalty of perjury, that the information in the notification is accurate and that you have the authority to enforce the copyrights that are claimed to be infringed; and
(6) a physical or electronic signature of the copyright owner or a person authorized to act on the copyright owner’s behalf. Failure to include all of the above information may result in the delay of the processing of your complaint.