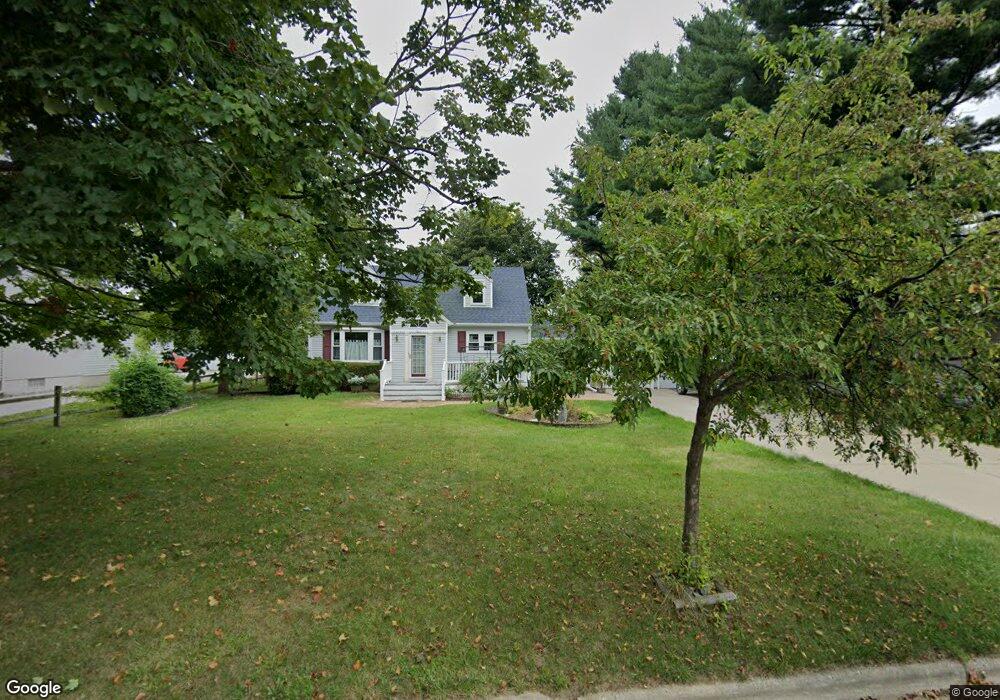
301 Redner St Lansing, MI 48911
Southern Lansing NeighborhoodEstimated Value: $149,033 - $225,000
3
Beds
2
Baths
2,091
Sq Ft
$86/Sq Ft
Est. Value
About This Home
This home is located at 301 Redner St, Lansing, MI 48911 and is currently estimated at $179,008, approximately $85 per square foot. 301 Redner St is a home located in Ingham County with nearby schools including Kendon School, Attwood School, and Everett High School.
Ownership History
Date
Name
Owned For
Owner Type
Purchase Details
Closed on
Oct 2, 2017
Sold by
Markham Randolph G
Bought by
Markham Proepties Llc
Current Estimated Value
Purchase Details
Closed on
Jul 12, 2016
Sold by
Markham Rebecca A
Bought by
Markham Randolph G and The Randolph G Markham Living Trust
Purchase Details
Closed on
Mar 26, 2008
Sold by
Mohundro Family Revocable Trust #1
Bought by
Scarnati William and Scarnati Deborah
Home Financials for this Owner
Home Financials are based on the most recent Mortgage that was taken out on this home.
Original Mortgage
$119,225
Outstanding Balance
$76,035
Interest Rate
6.1%
Mortgage Type
Purchase Money Mortgage
Estimated Equity
$102,973
Purchase Details
Closed on
Nov 20, 2006
Sold by
Mohundro Charles Irl and Mohundro Margaret Louise
Bought by
Mohundro Charles Irl and Mohundro Margaret Louise
Purchase Details
Closed on
Mar 17, 1999
Sold by
Mohundro Charlie Lee and Brown Lanita S
Bought by
Mohundro Charles I and Mohundro Margaret L
Create a Home Valuation Report for This Property
The Home Valuation Report is an in-depth analysis detailing your home's value as well as a comparison with similar homes in the area
Home Values in the Area
Average Home Value in this Area
Purchase History
| Date | Buyer | Sale Price | Title Company |
|---|---|---|---|
| Markham Proepties Llc | -- | None Available | |
| Markham Randolph G | -- | None Available | |
| Scarnati William | $125,500 | Tri County Title Agency Llc | |
| Mohundro Charles Irl | -- | None Available | |
| Mohundro Charles I | -- | -- |
Source: Public Records
Mortgage History
| Date | Status | Borrower | Loan Amount |
|---|---|---|---|
| Open | Scarnati William | $119,225 |
Source: Public Records
Tax History
| Year | Tax Paid | Tax Assessment Tax Assessment Total Assessment is a certain percentage of the fair market value that is determined by local assessors to be the total taxable value of land and additions on the property. | Land | Improvement |
|---|---|---|---|---|
| 2025 | $3,471 | $83,100 | $14,400 | $68,700 |
| 2024 | $28 | $72,000 | $14,400 | $57,600 |
| 2023 | $3,253 | $65,900 | $14,400 | $51,500 |
| 2022 | $2,932 | $62,700 | $17,300 | $45,400 |
| 2021 | $2,871 | $59,700 | $14,400 | $45,300 |
| 2020 | $2,853 | $55,900 | $14,400 | $41,500 |
| 2019 | $2,736 | $51,900 | $14,400 | $37,500 |
| 2018 | $2,563 | $46,000 | $14,400 | $31,600 |
| 2017 | $2,454 | $46,000 | $14,400 | $31,600 |
| 2016 | $2,426 | $43,500 | $14,400 | $29,100 |
| 2015 | $2,426 | $42,500 | $28,821 | $13,679 |
| 2014 | $2,426 | $43,300 | $34,585 | $8,715 |
Source: Public Records
Map
Nearby Homes
- 125 E Northrup St
- 208 E Northrup St
- 205 E Jolly Rd Unit 6
- 115 E Claremore Dr
- 5267 Crocus Ave
- 419 W Jolly Rd
- 5009 Kessler Dr
- 5008 Southgate Ave
- 201 E Syringa Dr
- 111 E Potter Ave
- 4731 Palmer St
- 221 W Everettdale Ave
- 1115 Shirley St
- 826 R G Curtiss Ave
- 1109 Barr Ave
- 4926 Burchfield Ave
- 4907 Burchfield Ave
- 6246 Gardenia Ave
- 4719 S Pennsylvania Ave
- 600 E Cavanaugh Rd
Your Personal Tour Guide
Ask me questions while you tour the home.