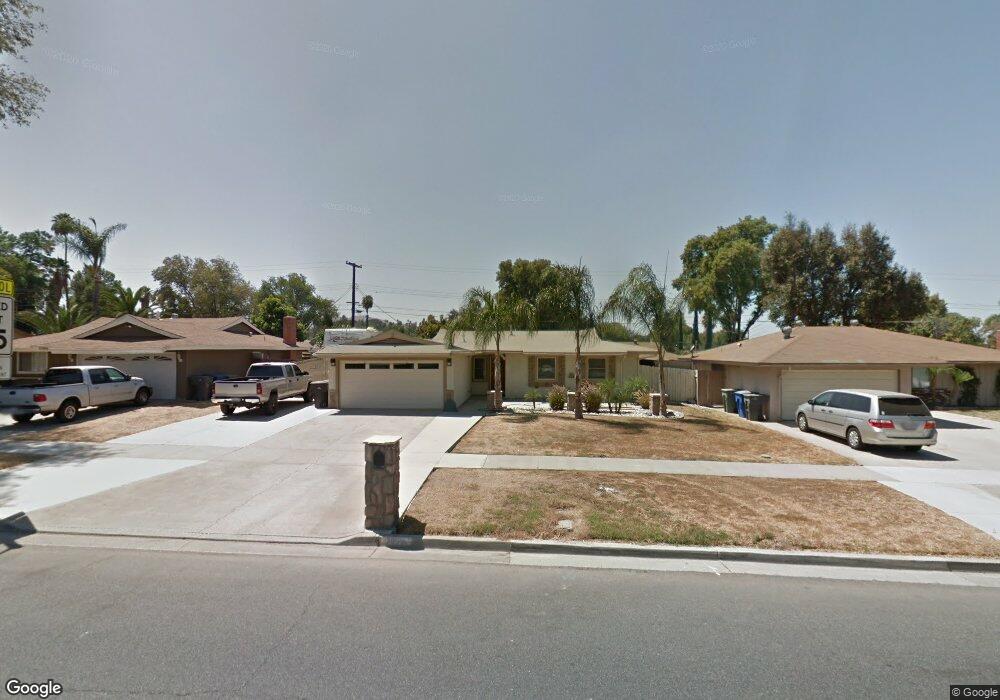
3012 Harrison St Riverside, CA 92503
Arlington South NeighborhoodEstimated Value: $601,000 - $612,000
3
Beds
2
Baths
1,335
Sq Ft
$455/Sq Ft
Est. Value
About This Home
This home is located at 3012 Harrison St, Riverside, CA 92503 and is currently estimated at $607,341, approximately $454 per square foot. 3012 Harrison St is a home located in Riverside County with nearby schools including Harrison Elementary School, Chemawa Middle School, and Arlington High School.
Ownership History
Date
Name
Owned For
Owner Type
Purchase Details
Closed on
May 18, 2010
Sold by
Rv Outlet Inc
Bought by
Ruvalcaba Jaime A
Current Estimated Value
Home Financials for this Owner
Home Financials are based on the most recent Mortgage that was taken out on this home.
Original Mortgage
$219,543
Outstanding Balance
$145,847
Interest Rate
4.87%
Mortgage Type
FHA
Estimated Equity
$461,494
Purchase Details
Closed on
Feb 18, 2010
Sold by
Bank Of America National Association
Bought by
Rv Outlet Inc
Purchase Details
Closed on
Jun 1, 2009
Sold by
Saldana Baltazar
Bought by
Bank Of America National Association
Purchase Details
Closed on
Sep 18, 2006
Sold by
Saldana Adolfina Arcos
Bought by
Saldana Baltazar
Purchase Details
Closed on
Aug 9, 2006
Sold by
Garvin Ava Rene
Bought by
Saldana Baltazar
Purchase Details
Closed on
Apr 2, 1999
Sold by
Maples Clyde A and Maples Blanche C
Bought by
Maples Clyde Alexander and Maples Blanche Crawford
Create a Home Valuation Report for This Property
The Home Valuation Report is an in-depth analysis detailing your home's value as well as a comparison with similar homes in the area
Home Values in the Area
Average Home Value in this Area
Purchase History
| Date | Buyer | Sale Price | Title Company |
|---|---|---|---|
| Ruvalcaba Jaime A | $222,500 | First American Title Company | |
| Rv Outlet Inc | $149,000 | Ticor Title Company | |
| Bank Of America National Association | $122,682 | None Available | |
| Saldana Baltazar | -- | Ticor Title Company | |
| Saldana Baltazar | $375,000 | Ticor Title Company | |
| Maples Clyde Alexander | -- | -- |
Source: Public Records
Mortgage History
| Date | Status | Borrower | Loan Amount |
|---|---|---|---|
| Open | Ruvalcaba Jaime A | $219,543 |
Source: Public Records
Tax History
| Year | Tax Paid | Tax Assessment Tax Assessment Total Assessment is a certain percentage of the fair market value that is determined by local assessors to be the total taxable value of land and additions on the property. | Land | Improvement |
|---|---|---|---|---|
| 2025 | $3,148 | $287,188 | $103,257 | $183,931 |
| 2023 | $3,148 | $276,039 | $99,249 | $176,790 |
| 2022 | $3,077 | $270,627 | $97,303 | $173,324 |
| 2021 | $3,044 | $265,322 | $95,396 | $169,926 |
| 2020 | $3,021 | $262,602 | $94,418 | $168,184 |
| 2019 | $2,965 | $257,454 | $92,567 | $164,887 |
| 2018 | $2,908 | $252,406 | $90,752 | $161,654 |
| 2017 | $2,856 | $247,458 | $88,973 | $158,485 |
| 2016 | $2,675 | $242,607 | $87,229 | $155,378 |
| 2015 | $2,637 | $238,965 | $85,920 | $153,045 |
| 2014 | $2,612 | $234,287 | $84,238 | $150,049 |
Source: Public Records
Map
Nearby Homes
- 9879 Canada Way
- 2855 Mcallister St
- 0 Drake Place Unit BB26048466
- 0 Vacant Land Unit CV25195566
- 0 Vacant Land Unit IV25136922
- 0 Via Verrazano Unit IV25221760
- 0 Road Runner Ridge Unit NP25232115
- 0 Road Runner Ridge Unit IV26045817
- 4107217 04107217000
- 9330 9332 Saffron Ct
- 0 Seven Hills Dr Unit IG24212380
- 9545 Calle la Cuesta
- 10028 Mildred Ct
- 2945 Tyler St
- 9525 Hannah Way
- 9523 Hannah Way
- 9539 Hannah Way
- 9520 Hannah Way
- 9529 Hannah Way
- 9537 Hannah Way
- 3022 Harrison St
- 2990 Harrison St
- 2997 Woodhaven St
- 3015 Woodhaven St
- 3034 Harrison St
- 2989 Woodhaven St
- 3027 Woodhaven St
- 2982 Harrison St
- 2981 Woodhaven St
- 3005 Harrison St
- 3039 Woodhaven St
- 3042 Harrison St
- 2991 Harrison St
- 3025 Harrison St
- 2974 Harrison St
- 2973 Woodhaven St
- 3035 Harrison St
- 3008 Woodhaven St
- 3016 Woodhaven St
- 2994 Woodhaven St
Your Personal Tour Guide
Ask me questions while you tour the home.