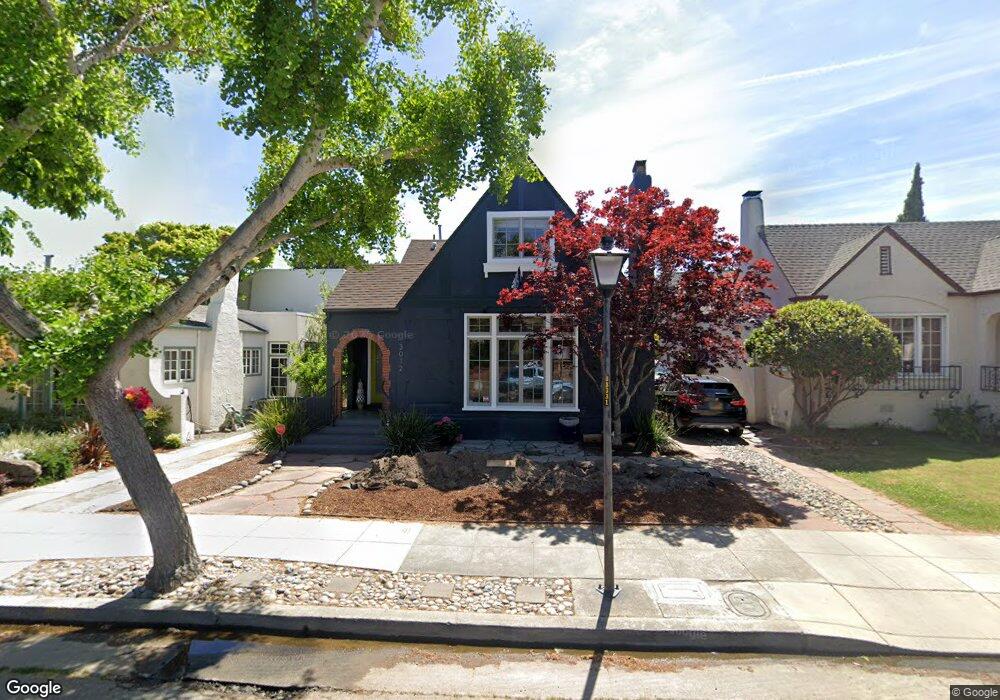
3012 Thompson Ave Alameda, CA 94501
Downtown Alameda NeighborhoodEstimated Value: $1,560,000 - $1,859,866
5
Beds
3
Baths
2,452
Sq Ft
$702/Sq Ft
Est. Value
About This Home
This home is located at 3012 Thompson Ave, Alameda, CA 94501 and is currently estimated at $1,720,217, approximately $701 per square foot. 3012 Thompson Ave is a home located in Alameda County with nearby schools including Edison Elementary School, Lincoln Middle School, and Alameda High School.
Ownership History
Date
Name
Owned For
Owner Type
Purchase Details
Closed on
Jul 8, 2010
Sold by
Wisherop Michael Paul and Wisherop Rhea Butler
Bought by
Wisherop Michael P and Wisherop Rhea B
Current Estimated Value
Home Financials for this Owner
Home Financials are based on the most recent Mortgage that was taken out on this home.
Original Mortgage
$572,000
Outstanding Balance
$380,861
Interest Rate
4.76%
Mortgage Type
New Conventional
Estimated Equity
$1,339,356
Purchase Details
Closed on
Jun 2, 2009
Sold by
Wisherop Michael and Wisherop Rhea
Bought by
Wisherop Michael P and Wisherop Rhea B
Purchase Details
Closed on
Jun 17, 2002
Sold by
Matza R Brian
Bought by
Wisherop Michael and Wisherop Rhea
Home Financials for this Owner
Home Financials are based on the most recent Mortgage that was taken out on this home.
Original Mortgage
$420,000
Interest Rate
6.86%
Mortgage Type
Credit Line Revolving
Purchase Details
Closed on
Sep 29, 2000
Sold by
Mackintosh Douglas and Estate Of Fay Dowell
Bought by
Matza R Brian
Create a Home Valuation Report for This Property
The Home Valuation Report is an in-depth analysis detailing your home's value as well as a comparison with similar homes in the area
Home Values in the Area
Average Home Value in this Area
Purchase History
We collect this data history from publicly available records. To have your information removed, we recommend requesting removal directly through your county’s website.
| Date | Buyer | Sale Price | Title Company |
|---|---|---|---|
| Wisherop Michael P | -- | Old Republic Title Company | |
| Wisherop Michael Paul | -- | Old Republic Title Company | |
| Wisherop Michael P | -- | None Available | |
| Wisherop Michael | $525,000 | First American Title Guarant | |
| Matza R Brian | $340,000 | American Title Co |
Source: Public Records
Mortgage History
We collect this data history from publicly available records. To have your information removed, we recommend requesting removal directly through your county’s website.
| Date | Status | Borrower | Loan Amount |
|---|---|---|---|
| Open | Wisherop Michael Paul | $572,000 | |
| Closed | Wisherop Michael | $420,000 |
Source: Public Records
Tax History
| Year | Tax Paid | Tax Assessment Tax Assessment Total Assessment is a certain percentage of the fair market value that is determined by local assessors to be the total taxable value of land and additions on the property. | Land | Improvement |
|---|---|---|---|---|
| 2025 | $13,449 | $912,008 | $232,659 | $686,349 |
| 2024 | $13,449 | $893,990 | $228,097 | $672,893 |
| 2023 | $12,947 | $883,328 | $223,626 | $659,702 |
| 2022 | $12,665 | $859,008 | $219,241 | $646,767 |
| 2021 | $12,362 | $842,031 | $214,943 | $634,088 |
| 2020 | $12,216 | $840,327 | $212,739 | $627,588 |
| 2019 | $11,448 | $823,854 | $208,569 | $615,285 |
| 2018 | $11,164 | $807,704 | $204,480 | $603,224 |
| 2017 | $10,652 | $791,871 | $200,472 | $591,399 |
| 2016 | $10,673 | $776,349 | $196,542 | $579,807 |
| 2015 | $10,641 | $764,691 | $193,591 | $571,100 |
| 2014 | $10,155 | $749,716 | $189,800 | $559,916 |
Source: Public Records
Map
Nearby Homes
- 1635 High St
- 1420 Mound St
- 3103 Central Ave
- 1376 Versailles Ave
- 3239 Briggs Ave
- 3241 Briggs Ave
- 2608 Central Ave
- 1415 Broadway
- 3248 Briggs Ave
- 2516 Buena Vista Ave
- 2517 Webb Ave
- 3315 Central Ave
- 3287 Briggs Ave
- 2515 Central Ave Unit 102
- 1219 Pearl St
- 3233 San Jose Ave
- 1817 Everett St
- 1901 Everett St
- 1125 Versailles Ave
- 3090 Glascock St Unit 405
- 3010 Thompson Ave
- 3016 Thompson Ave
- 3006 Thompson Ave
- 3020 Thompson Ave
- 3002 Thompson Ave
- 3022 Thompson Ave
- 2929 Lincoln Ave
- 2925 Lincoln Ave
- 2933 Lincoln Ave
- 2952 Southwood Dr
- 2937 Lincoln Ave
- 3011 Thompson Ave
- 2921 Lincoln Ave
- 3000 Thompson Ave
- 3024 Thompson Ave
- 2960 Southwood Dr
- 2941 Lincoln Ave
- 2915 Lincoln Ave
- 3017 Thompson Ave
- 2942 Southwood Dr
Your Personal Tour Guide
Ask me questions while you tour the home.