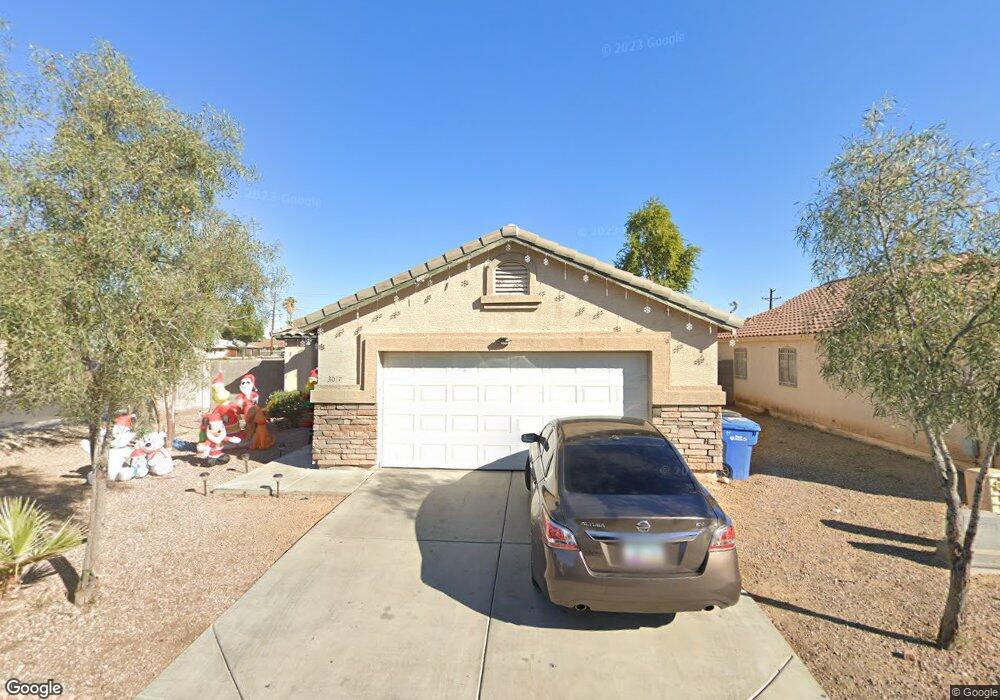
3017 N 83rd Dr Phoenix, AZ 85037
Estimated Value: $297,630 - $473,000
--
Bed
2
Baths
1,108
Sq Ft
$329/Sq Ft
Est. Value
About This Home
This home is located at 3017 N 83rd Dr, Phoenix, AZ 85037 and is currently estimated at $364,408, approximately $328 per square foot. 3017 N 83rd Dr is a home located in Maricopa County with nearby schools including Desert Horizon Elementary School, Copper Canyon High School, and Pan-American Charter School.
Ownership History
Date
Name
Owned For
Owner Type
Purchase Details
Closed on
Dec 17, 2019
Sold by
Gonzalez Ruben and Gonzalez Reina
Bought by
Gonzalez Ruben and Gonzalez Reina
Current Estimated Value
Purchase Details
Closed on
Jun 8, 2007
Sold by
Gonzalez Ruben
Bought by
Gonzalez Ruben and Gonzalez Reina
Home Financials for this Owner
Home Financials are based on the most recent Mortgage that was taken out on this home.
Original Mortgage
$154,000
Outstanding Balance
$93,976
Interest Rate
6.14%
Mortgage Type
New Conventional
Estimated Equity
$270,432
Purchase Details
Closed on
Mar 29, 2004
Sold by
Gonzalez Ruben
Bought by
Gonzalez Ruben and Gonzalez Reina
Home Financials for this Owner
Home Financials are based on the most recent Mortgage that was taken out on this home.
Original Mortgage
$90,320
Interest Rate
5.56%
Mortgage Type
Purchase Money Mortgage
Create a Home Valuation Report for This Property
The Home Valuation Report is an in-depth analysis detailing your home's value as well as a comparison with similar homes in the area
Home Values in the Area
Average Home Value in this Area
Purchase History
| Date | Buyer | Sale Price | Title Company |
|---|---|---|---|
| Gonzalez Ruben | -- | None Available | |
| Gonzalez Ruben | -- | Tsa Title Agency | |
| Gonzalez Ruben | -- | Tsa Title Agency | |
| Gonzalez Ruben | -- | Security Title Agency | |
| Gonzalez Ruben | -- | Security Title Agency | |
| Gonzalez Ruben | $112,900 | Security Title Agency |
Source: Public Records
Mortgage History
| Date | Status | Borrower | Loan Amount |
|---|---|---|---|
| Open | Gonzalez Ruben | $154,000 | |
| Closed | Gonzalez Ruben | $90,320 |
Source: Public Records
Tax History Compared to Growth
Tax History
| Year | Tax Paid | Tax Assessment Tax Assessment Total Assessment is a certain percentage of the fair market value that is determined by local assessors to be the total taxable value of land and additions on the property. | Land | Improvement |
|---|---|---|---|---|
| 2025 | $1,081 | $7,450 | -- | -- |
| 2024 | $1,097 | $7,095 | -- | -- |
| 2023 | $1,097 | $22,080 | $4,410 | $17,670 |
| 2022 | $1,056 | $16,860 | $3,370 | $13,490 |
| 2021 | $1,011 | $15,470 | $3,090 | $12,380 |
| 2020 | $983 | $14,120 | $2,820 | $11,300 |
| 2019 | $975 | $12,520 | $2,500 | $10,020 |
| 2018 | $920 | $11,220 | $2,240 | $8,980 |
| 2017 | $862 | $10,400 | $2,080 | $8,320 |
| 2016 | $796 | $9,130 | $1,820 | $7,310 |
| 2015 | $682 | $7,900 | $1,580 | $6,320 |
Source: Public Records
Map
Nearby Homes
- 3328 98th Ln
- 3324 98th Ln
- 8504 W Windsor Ave
- 8201 W Whitton Ave
- 8118 W Osborn Rd
- 2932 N 98th Ln
- 7940 W Avalon Dr
- 8663 W Monterey Way
- 8151 W Clarendon Ave
- 3317 N 80th Ave
- 8147 W Clarendon Ave
- 2431 N 83rd Dr Unit 74
- 3432 N 86th Ave
- 2541 N 86th Ave
- 8524 W Weldon Ave
- 2337 N 83rd Dr Unit 92
- 8742 W Edgemont Ave
- 8818 W Pinchot Ave
- 8429 W Vernon Ave Unit 115
- 8741 W Osborn Rd
- 3013 N 83rd Dr
- 3009 N 83rd Dr
- 3018 N 83rd Ln
- 8302 W Avalon Dr
- 8306 W Avalon Dr
- 8313 W Avalon Dr
- 8310 W Avalon Dr
- 8316 W Catalina Dr
- 8317 W Avalon Dr
- 8314 W Avalon Dr
- 8253 W Avalon Dr
- 8252 W Avalon Dr
- 8320 W Catalina Dr
- 3050 N 83rd Ln
- 3050 N 83rd Ln
- 3050 N 83rd Ave
- 3002 N 83rd Ave
- 3005 N 83rd Dr
- 8318 W Avalon Dr
- 8321 W Avalon Dr