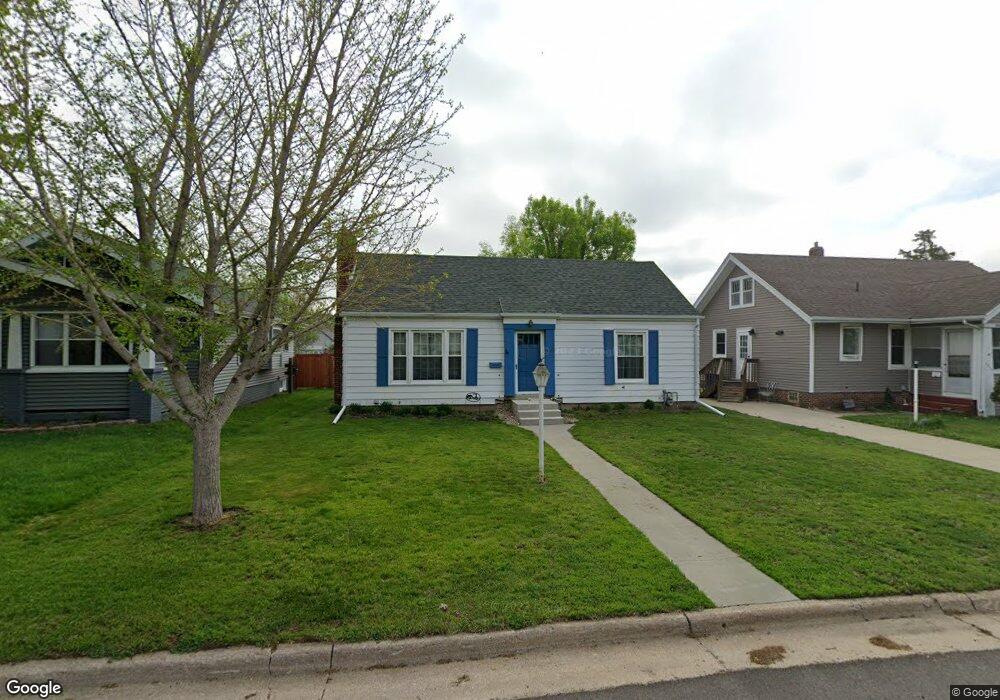
3019 E Ave NE Cedar Rapids, IA 52402
Kenwood Park NeighborhoodEstimated Value: $151,000 - $176,000
2
Beds
3
Baths
924
Sq Ft
$177/Sq Ft
Est. Value
About This Home
This home is located at 3019 E Ave NE, Cedar Rapids, IA 52402 and is currently estimated at $163,116, approximately $176 per square foot. 3019 E Ave NE is a home located in Linn County with nearby schools including Franklin Middle School, George Washington High School, and St. Matthew School.
Ownership History
Date
Name
Owned For
Owner Type
Purchase Details
Closed on
Feb 28, 2007
Sold by
Steeg Angela G Ver and Dwyer Matthew R
Bought by
Borkowski Russell L and Borkowski Nancy K
Current Estimated Value
Home Financials for this Owner
Home Financials are based on the most recent Mortgage that was taken out on this home.
Original Mortgage
$65,000
Outstanding Balance
$39,365
Interest Rate
6.27%
Mortgage Type
Unknown
Estimated Equity
$123,751
Purchase Details
Closed on
Jul 26, 2006
Sold by
Smith John G and Smith Patricia S
Bought by
Ver Dwyer Matthew R and Ver Sterg Angela G
Home Financials for this Owner
Home Financials are based on the most recent Mortgage that was taken out on this home.
Original Mortgage
$73,800
Interest Rate
6.82%
Mortgage Type
Unknown
Purchase Details
Closed on
Jan 7, 2002
Sold by
Corson Melvin J
Bought by
Smith John G and Smith Patricia S
Create a Home Valuation Report for This Property
The Home Valuation Report is an in-depth analysis detailing your home's value as well as a comparison with similar homes in the area
Home Values in the Area
Average Home Value in this Area
Purchase History
| Date | Buyer | Sale Price | Title Company |
|---|---|---|---|
| Borkowski Russell L | $113,500 | None Available | |
| Ver Dwyer Matthew R | $81,500 | None Available | |
| Smith John G | $64,500 | -- |
Source: Public Records
Mortgage History
| Date | Status | Borrower | Loan Amount |
|---|---|---|---|
| Open | Borkowski Russell L | $65,000 | |
| Previous Owner | Ver Dwyer Matthew R | $73,800 |
Source: Public Records
Tax History
| Year | Tax Paid | Tax Assessment Tax Assessment Total Assessment is a certain percentage of the fair market value that is determined by local assessors to be the total taxable value of land and additions on the property. | Land | Improvement |
|---|---|---|---|---|
| 2025 | $2,158 | $152,800 | $28,800 | $124,000 |
| 2024 | $2,376 | $139,400 | $23,800 | $115,600 |
| 2023 | $2,376 | $139,400 | $23,800 | $115,600 |
| 2022 | $2,332 | $121,500 | $23,800 | $97,700 |
| 2021 | $2,300 | $121,500 | $23,800 | $97,700 |
| 2020 | $2,300 | $112,800 | $20,000 | $92,800 |
| 2019 | $2,156 | $108,500 | $20,000 | $88,500 |
Source: Public Records
Map
Nearby Homes
- 521 29th St NE
- 231 32nd St NE
- 634 33rd St NE
- 120 32nd St NE
- 700 25th St NE
- 308 34th St NE
- 2411 G Ave NE
- 203 27th St NE
- 3015 2nd Ave SE
- 2522 A Ave NE
- 2416 B Ave NE
- 628 36th St NE
- 231 31st Street Dr SE
- 229 28th Street Dr SE
- 208 24th St NE
- 239 28th Street Dr SE
- 3718 C Ave NE
- 2423 1st Ave SE
- 152 37th St NE
- 140 35th Street Dr SE Unit 1
Your Personal Tour Guide
Ask me questions while you tour the home.