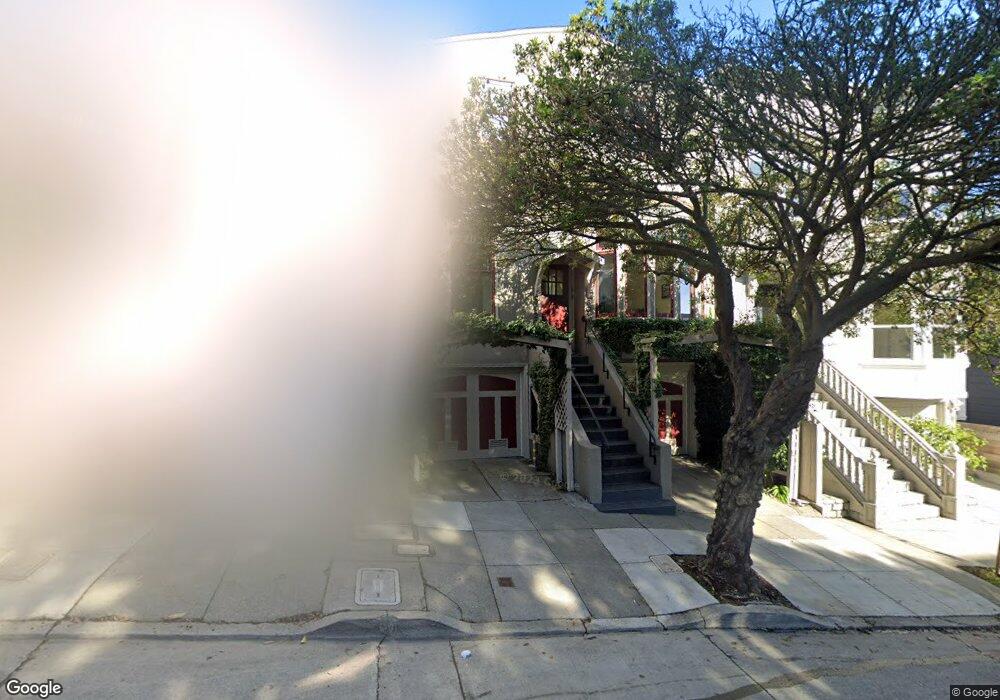
3020 Pine St San Francisco, CA 94115
Lower Pacific Heights NeighborhoodEstimated Value: $1,213,000 - $1,537,000
2
Beds
1
Bath
1,422
Sq Ft
$973/Sq Ft
Est. Value
About This Home
This home is located at 3020 Pine St, San Francisco, CA 94115 and is currently estimated at $1,383,726, approximately $973 per square foot. 3020 Pine St is a home located in San Francisco County with nearby schools including Cobb (William L.) Elementary School, Roosevelt Middle School, and San Francisco Waldorf School.
Ownership History
Date
Name
Owned For
Owner Type
Purchase Details
Closed on
Aug 28, 2007
Sold by
Huberman Robert
Bought by
Marwitz Edwin C and Adams Mary Noel
Current Estimated Value
Home Financials for this Owner
Home Financials are based on the most recent Mortgage that was taken out on this home.
Original Mortgage
$132,750
Outstanding Balance
$109,829
Interest Rate
6.74%
Mortgage Type
Credit Line Revolving
Estimated Equity
$1,273,897
Purchase Details
Closed on
Apr 11, 1996
Sold by
Coppola Charles and Kitajima Ann
Bought by
Welch Mark D
Home Financials for this Owner
Home Financials are based on the most recent Mortgage that was taken out on this home.
Original Mortgage
$124,000
Interest Rate
7.41%
Create a Home Valuation Report for This Property
The Home Valuation Report is an in-depth analysis detailing your home's value as well as a comparison with similar homes in the area
Home Values in the Area
Average Home Value in this Area
Purchase History
| Date | Buyer | Sale Price | Title Company |
|---|---|---|---|
| Marwitz Edwin C | $885,000 | Fidelity National Title Co | |
| Welch Mark D | $345,000 | Fidelity National Title Ins |
Source: Public Records
Mortgage History
| Date | Status | Borrower | Loan Amount |
|---|---|---|---|
| Open | Marwitz Edwin C | $132,750 | |
| Previous Owner | Welch Mark D | $124,000 |
Source: Public Records
Tax History Compared to Growth
Tax History
| Year | Tax Paid | Tax Assessment Tax Assessment Total Assessment is a certain percentage of the fair market value that is determined by local assessors to be the total taxable value of land and additions on the property. | Land | Improvement |
|---|---|---|---|---|
| 2025 | $14,057 | $1,162,426 | $788,092 | $374,334 |
| 2024 | $14,057 | $1,139,636 | $772,640 | $366,996 |
| 2023 | $13,842 | $1,117,292 | $757,492 | $359,800 |
| 2022 | $13,573 | $1,095,386 | $742,640 | $352,746 |
| 2021 | $13,330 | $1,073,910 | $728,080 | $345,830 |
| 2020 | $13,395 | $1,062,900 | $720,616 | $342,284 |
| 2019 | $12,935 | $1,042,062 | $706,488 | $335,574 |
| 2018 | $12,499 | $1,021,632 | $692,636 | $328,996 |
| 2017 | $12,052 | $1,001,602 | $679,056 | $322,546 |
| 2016 | $11,849 | $981,964 | $665,742 | $316,222 |
| 2015 | $11,701 | $967,216 | $655,742 | $311,474 |
| 2014 | $11,392 | $948,272 | $642,898 | $305,374 |
Source: Public Records
Map
Nearby Homes
- 3014 Pine St
- 3014 Pine St Unit A
- 2978 Pine St
- 3100 California St
- 1819 Lyon St Unit 3
- 1819 Lyon St Unit 1
- 333 Presidio Ave Unit 5
- 2825 Pine St
- 1450 Lyon St
- 1910 Baker St
- 440 Laurel St
- 436a Laurel St
- 2033 Broderick St
- 2025 Broderick St Unit 6
- 3515 Sacramento St
- 22 Wood St
- 3332 Washington St
- 315 Laurel St
- 3124 Washington St
- 2654-2656 Bush St
- 3018 Pine St
- 3022 Pine St
- 3016 Pine St
- 3042 Pine St
- 3012 Pine St Unit AB
- 3012 Pine St
- 3044 Pine St
- 3014a Pine St
- 3008 Pine St Unit 3010
- 542 Presidio Ave Unit 544
- 538 Presidio Ave
- 536 Presidio Ave
- 532 Presidio Ave
- 530 Presidio Ave
- 560 Presidio Ave Unit 2
- 560 Presidio Ave Unit 8
- 560 Presidio Ave Unit 7
- 560 Presidio Ave Unit 5
- 560 Presidio Ave Unit 6
- 560 Presidio Ave Unit 4