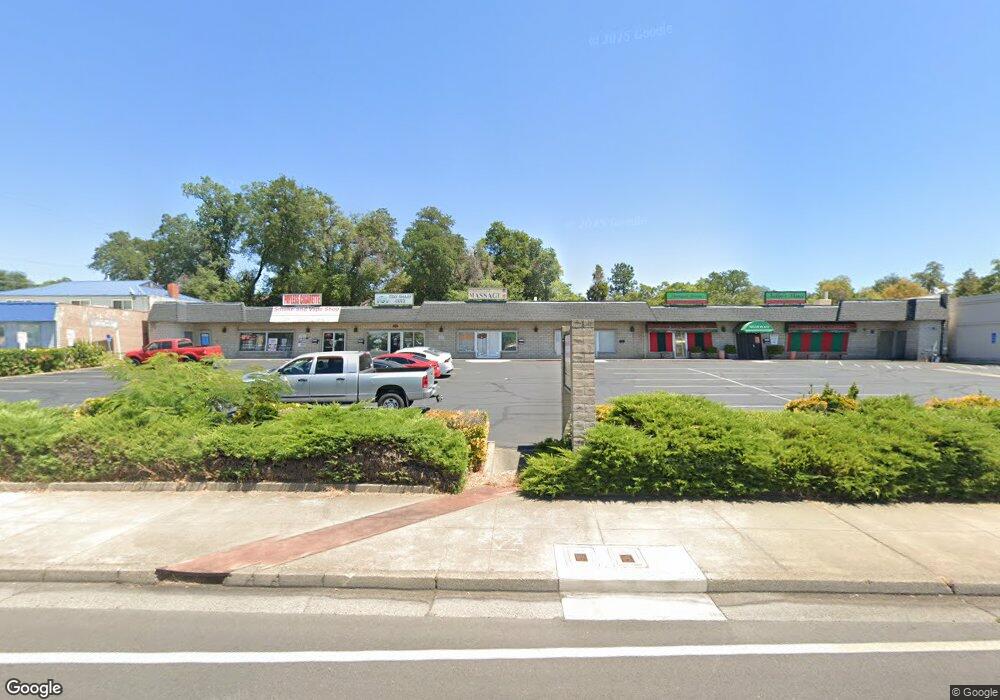
3025 Bechelli Ln Redding, CA 96002
South Bechelli Neighborhood
--
Bed
--
Bath
4,952
Sq Ft
0.31
Acres
About This Home
This home is located at 3025 Bechelli Ln, Redding, CA 96002. 3025 Bechelli Ln is a home located in Shasta County with nearby schools including Rother Elementary School, Parsons Junior High School, and Enterprise High School.
Ownership History
Date
Name
Owned For
Owner Type
Purchase Details
Closed on
Apr 26, 2012
Sold by
Mack Michele
Bought by
Bella Associates
Purchase Details
Closed on
Mar 1, 2012
Sold by
Tumino Vincent and Tumino Lucille
Bought by
Mack Michele
Purchase Details
Closed on
Oct 20, 2011
Sold by
Tumino Vincent
Bought by
Tumino Vincent and Tumino Lucille
Purchase Details
Closed on
Aug 16, 2011
Sold by
Tumino Vincent
Bought by
Tumino Vincent
Purchase Details
Closed on
Jan 3, 2009
Sold by
Tumino Vincent
Bought by
Mack Michele Marie Tumino and Mack Christopher Kevin
Purchase Details
Closed on
Dec 16, 2008
Sold by
Tumino Vincent
Bought by
Mack Michele Marie Tumino and Mack Christopher Kevin
Purchase Details
Closed on
Aug 29, 2007
Sold by
Tumino Vincent
Bought by
Mack Michele Marie Tumino and Mack Christopher Kevin
Create a Home Valuation Report for This Property
The Home Valuation Report is an in-depth analysis detailing your home's value as well as a comparison with similar homes in the area
Home Values in the Area
Average Home Value in this Area
Purchase History
| Date | Buyer | Sale Price | Title Company |
|---|---|---|---|
| Bella Associates | -- | None Available | |
| Mack Michele | -- | None Available | |
| Tumino Vincent | -- | None Available | |
| Tumino Vincent | -- | None Available | |
| Mack Michele Marie Tumino | -- | None Available | |
| Mack Michele Marie Tumino | -- | None Available | |
| Mack Michele Marie Tumino | -- | None Available |
Source: Public Records
Tax History Compared to Growth
Tax History
| Year | Tax Paid | Tax Assessment Tax Assessment Total Assessment is a certain percentage of the fair market value that is determined by local assessors to be the total taxable value of land and additions on the property. | Land | Improvement |
|---|---|---|---|---|
| 2025 | $5,731 | $524,929 | $145,442 | $379,487 |
| 2024 | $5,653 | $514,638 | $142,591 | $372,047 |
| 2023 | $5,653 | $504,548 | $139,796 | $364,752 |
| 2022 | $5,496 | $494,655 | $137,055 | $357,600 |
| 2021 | $5,311 | $484,957 | $134,368 | $350,589 |
| 2020 | $5,289 | $479,986 | $132,991 | $346,995 |
| 2019 | $5,247 | $470,576 | $130,384 | $340,192 |
| 2018 | $5,188 | $461,350 | $127,828 | $333,522 |
| 2017 | $5,281 | $452,305 | $125,322 | $326,983 |
| 2016 | $4,942 | $443,437 | $122,865 | $320,572 |
| 2015 | $4,902 | $436,777 | $121,020 | $315,757 |
| 2014 | $4,868 | $428,222 | $118,650 | $309,572 |
Source: Public Records
Map
Nearby Homes
- 550 Parsons Dr
- 2810 Bechelli Ln
- 2901 Blue View St
- 0 Churn Creek Rd Unit 25-496
- 0 Churn Creek Rd Unit 25-5491
- 1209 C St
- 3348 School St
- 3428 Adams Ln
- 3540 Ricardo Ave
- 952 Camino Ct
- 3527 Adams Ln
- 1091 Del Sol Place
- 2590 Henderson Rd
- 564 Estate St
- 3178 Lawrence Rd
- 1221 E Cypress Ave Unit 48
- 1221 E Cypress Ave Unit 67
- 1221 E Cypress Ave Unit 93
- 3708 Traverse St
- 2820 Alfreda Way
- 3025 3055 Bechelli Ln
- 3001 Bechelli Ln
- 541 Hartnell Ave
- 563 Hartnell Ave Unit 565
- 3071 Bechelli
- 581 Hartnell Ave
- 3032 Bechelli Ln
- 0 Hartnell Ave
- 583 Hartnell Ave
- 548 Hartnell Ave
- 579 Hartnell Ave
- 3000 Bechelli Ln
- 3097 Bechelli Ln
- 324 Wilshire Dr
- 568 Hartnell Ave
- 540 Wilshire Dr
- 2951 Bechelli Ln
- 3010 C St
- 588 Hartnell Ave
- 2986 Bechelli Ln