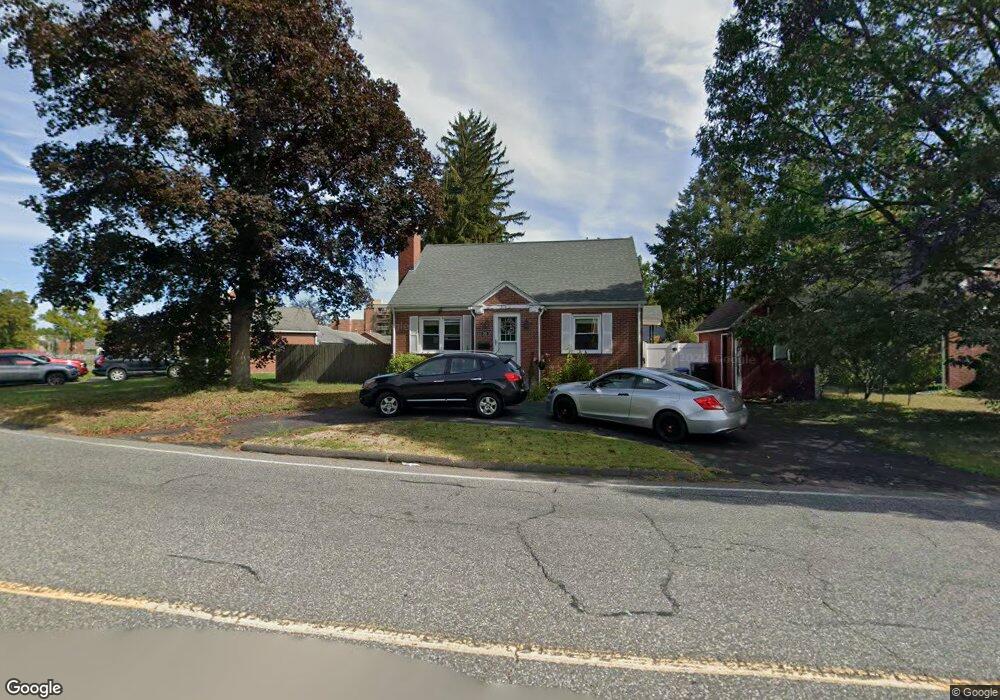
303 Cabot St Holyoke, MA 01040
Estimated Value: $250,780 - $305,000
4
Beds
1
Bath
1,571
Sq Ft
$173/Sq Ft
Est. Value
About This Home
This home is located at 303 Cabot St, Holyoke, MA 01040 and is currently estimated at $271,695, approximately $172 per square foot. 303 Cabot St is a home located in Hampden County with nearby schools including Butterfield Elementary School, Lt. Elmer J. McMahon Elementary School, and Holyoke High School.
Ownership History
Date
Name
Owned For
Owner Type
Purchase Details
Closed on
Aug 14, 2009
Sold by
Jeffers Stephen and Jeffers Andrea M
Bought by
Gamache Melissa M
Current Estimated Value
Home Financials for this Owner
Home Financials are based on the most recent Mortgage that was taken out on this home.
Original Mortgage
$137,725
Outstanding Balance
$90,116
Interest Rate
5.36%
Mortgage Type
Purchase Money Mortgage
Estimated Equity
$181,579
Purchase Details
Closed on
Dec 30, 2004
Sold by
Dezess John L and Dezess Tina
Bought by
Jeffers Andrea M and Jeffers Stephen
Home Financials for this Owner
Home Financials are based on the most recent Mortgage that was taken out on this home.
Original Mortgage
$141,550
Interest Rate
5.73%
Mortgage Type
Purchase Money Mortgage
Purchase Details
Closed on
Jul 24, 1995
Sold by
Prost Constant E and Prost Kathleen F
Bought by
Dezess John L and Bouchard Tina
Create a Home Valuation Report for This Property
The Home Valuation Report is an in-depth analysis detailing your home's value as well as a comparison with similar homes in the area
Home Values in the Area
Average Home Value in this Area
Purchase History
| Date | Buyer | Sale Price | Title Company |
|---|---|---|---|
| Gamache Melissa M | $155,500 | -- | |
| Jeffers Andrea M | $149,000 | -- | |
| Dezess John L | $78,000 | -- |
Source: Public Records
Mortgage History
| Date | Status | Borrower | Loan Amount |
|---|---|---|---|
| Open | Gamache Melissa M | $137,725 | |
| Previous Owner | Jeffers Andrea M | $141,550 | |
| Previous Owner | Dezess John L | $26,341 | |
| Previous Owner | Dezess John L | $18,563 | |
| Previous Owner | Dezess John L | $90,097 | |
| Previous Owner | Dezess John L | $11,068 |
Source: Public Records
Tax History Compared to Growth
Tax History
| Year | Tax Paid | Tax Assessment Tax Assessment Total Assessment is a certain percentage of the fair market value that is determined by local assessors to be the total taxable value of land and additions on the property. | Land | Improvement |
|---|---|---|---|---|
| 2025 | $3,597 | $206,000 | $42,100 | $163,900 |
| 2024 | $3,415 | $180,200 | $39,900 | $140,300 |
| 2023 | $3,266 | $174,100 | $39,900 | $134,200 |
| 2022 | $3,139 | $163,000 | $39,900 | $123,100 |
| 2021 | $2,944 | $152,800 | $36,300 | $116,500 |
| 2020 | $2,791 | $146,300 | $36,300 | $110,000 |
| 2019 | $2,677 | $138,800 | $30,800 | $108,000 |
| 2018 | $2,548 | $133,200 | $30,800 | $102,400 |
| 2017 | $2,553 | $133,200 | $30,800 | $102,400 |
| 2016 | $2,625 | $137,300 | $30,800 | $106,500 |
| 2015 | $2,614 | $137,300 | $30,800 | $106,500 |
Source: Public Records
Map
Nearby Homes