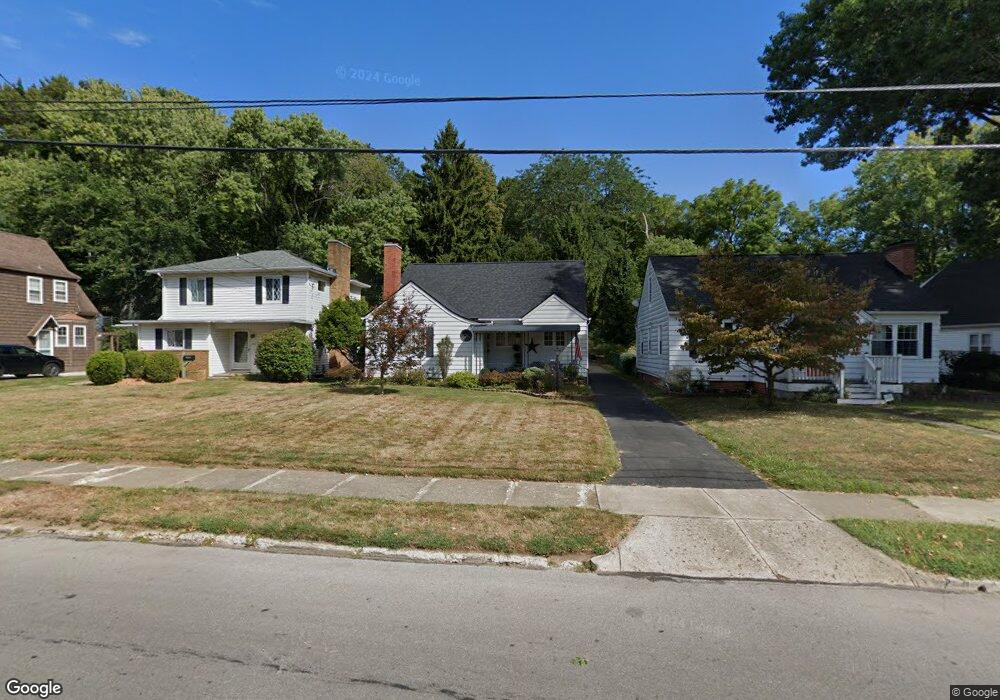
303 Edgewood Ave Lancaster, OH 43130
Estimated Value: $267,000 - $273,000
3
Beds
1
Bath
1,800
Sq Ft
$150/Sq Ft
Est. Value
About This Home
This home is located at 303 Edgewood Ave, Lancaster, OH 43130 and is currently estimated at $270,560, approximately $150 per square foot. 303 Edgewood Ave is a home located in Fairfield County with nearby schools including Tarhe Elementary School, General Sherman Junior High School, and Lancaster High School.
Ownership History
Date
Name
Owned For
Owner Type
Purchase Details
Closed on
Oct 30, 2000
Sold by
Confer Milton W
Bought by
Tammy J Ward-Raines
Current Estimated Value
Home Financials for this Owner
Home Financials are based on the most recent Mortgage that was taken out on this home.
Original Mortgage
$102,600
Outstanding Balance
$35,345
Interest Rate
7.9%
Mortgage Type
New Conventional
Estimated Equity
$235,215
Purchase Details
Closed on
Jan 5, 1998
Sold by
Grate Robert L
Bought by
Confer Milton W and Confer Norma J
Home Financials for this Owner
Home Financials are based on the most recent Mortgage that was taken out on this home.
Original Mortgage
$79,000
Interest Rate
7.28%
Mortgage Type
New Conventional
Purchase Details
Closed on
Mar 29, 1996
Sold by
Justus Ross E
Bought by
Grate Robert L and Grate Marion C
Home Financials for this Owner
Home Financials are based on the most recent Mortgage that was taken out on this home.
Original Mortgage
$83,700
Interest Rate
6.98%
Mortgage Type
New Conventional
Create a Home Valuation Report for This Property
The Home Valuation Report is an in-depth analysis detailing your home's value as well as a comparison with similar homes in the area
Home Values in the Area
Average Home Value in this Area
Purchase History
| Date | Buyer | Sale Price | Title Company |
|---|---|---|---|
| Tammy J Ward-Raines | $114,000 | -- | |
| Confer Milton W | $99,000 | -- | |
| Grate Robert L | $93,000 | -- |
Source: Public Records
Mortgage History
| Date | Status | Borrower | Loan Amount |
|---|---|---|---|
| Open | Tammy J Ward-Raines | $102,600 | |
| Previous Owner | Confer Milton W | $79,000 | |
| Previous Owner | Grate Robert L | $83,700 |
Source: Public Records
Tax History
| Year | Tax Paid | Tax Assessment Tax Assessment Total Assessment is a certain percentage of the fair market value that is determined by local assessors to be the total taxable value of land and additions on the property. | Land | Improvement |
|---|---|---|---|---|
| 2025 | $5,734 | $93,690 | $21,440 | $72,250 |
| 2024 | $5,734 | $63,780 | $14,030 | $49,750 |
| 2023 | $2,320 | $63,780 | $14,030 | $49,750 |
| 2022 | $2,329 | $63,780 | $14,030 | $49,750 |
| 2021 | $1,871 | $48,010 | $11,690 | $36,320 |
| 2020 | $1,793 | $48,010 | $11,690 | $36,320 |
| 2019 | $1,705 | $48,010 | $11,690 | $36,320 |
| 2018 | $1,424 | $37,440 | $11,690 | $25,750 |
| 2017 | $1,424 | $38,080 | $9,740 | $28,340 |
| 2016 | $1,387 | $38,080 | $9,740 | $28,340 |
| 2015 | $1,381 | $36,800 | $9,740 | $27,060 |
| 2014 | $1,316 | $36,800 | $9,740 | $27,060 |
| 2013 | $1,316 | $36,800 | $9,740 | $27,060 |
Source: Public Records
Map
Nearby Homes
- 0 Hillside Ave
- 1156 Forest Rose Ave
- 330 Park St
- 181 Marks Ave
- 148 Marks Ave
- 0 Marks Ave Unit 225036443
- 336 Reber Ave
- 130 W Fair Ave
- 123 Arnold Ave
- 820 N Broad St
- 0 Wacker Dr Unit 225036189
- 202 Wildwood Ave
- 165 Lake St
- 526 N Columbus St
- 844 Washington Ave
- 515 N Columbus St
- 1004 W Fair Ave
- 311 E Allen St
- 233 Union St
- 600 N High St
- 305 Edgewood Ave
- 301 Edgewood Ave
- 251 Edgewood Ave
- 310 Hillside Ave
- 317 Edgewood Ave
- 1159 Forest Rose Ave
- 223 Edgewood Ave
- 1155 Forest Rose Ave
- 1160 Forest Rose Ave
- 320 Edgewood Ave
- 228 Kinkead Ave
- 1153 Forest Rose Ave
- 329 Edgewood Ave
- 327 Hillside Ave
- 220 Kinkead Ave
- 220 Edgewood Ave
- 217 Edgewood Ave
- 1154 Olds Ave
- 1152 Olds Ave
- 1147 Forest Rose Ave
Your Personal Tour Guide
Ask me questions while you tour the home.