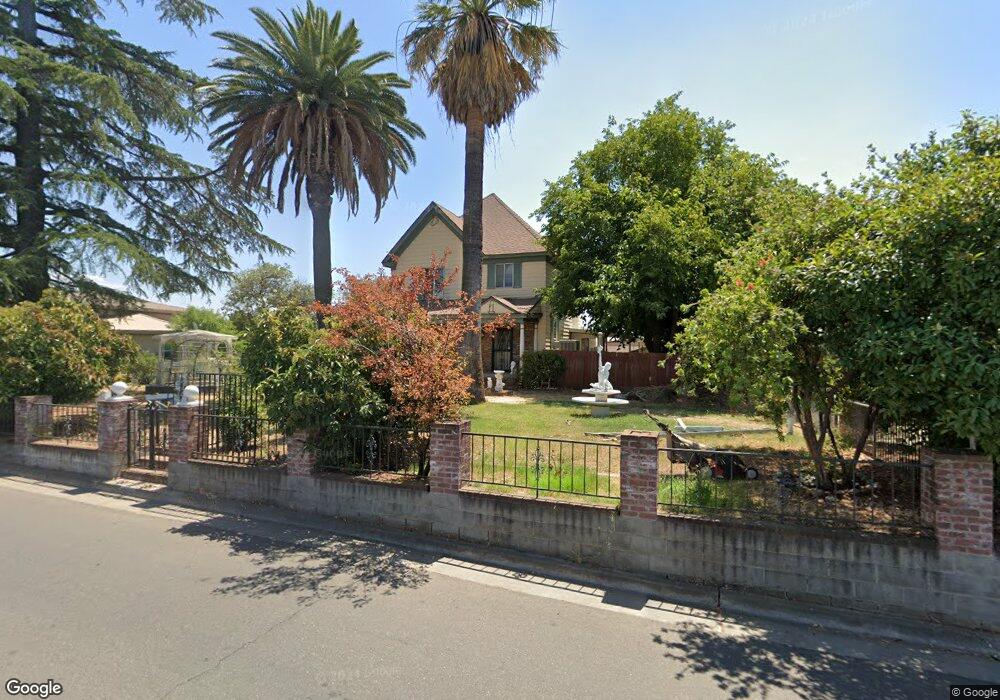
303 Solano St Corning, CA 96021
Estimated Value: $229,000 - $384,000
3
Beds
3
Baths
2,187
Sq Ft
$145/Sq Ft
Est. Value
About This Home
This home is located at 303 Solano St, Corning, CA 96021 and is currently estimated at $316,607, approximately $144 per square foot. 303 Solano St is a home located in Tehama County with nearby schools including Olive View Elementary School, Maywood Middle School, and Corning High School.
Ownership History
Date
Name
Owned For
Owner Type
Purchase Details
Closed on
Mar 9, 2023
Sold by
Worsham Kathryn T
Bought by
Kathryn T Worsham Trust
Current Estimated Value
Purchase Details
Closed on
Feb 21, 2012
Sold by
Blankenship Lou Kathrin
Bought by
Blankenship Lou Kathrin and Worsham Kathryn T
Purchase Details
Closed on
Jan 28, 2010
Sold by
Blankenship Lou Kathrin
Bought by
Blankenship Lou Kathrin
Home Financials for this Owner
Home Financials are based on the most recent Mortgage that was taken out on this home.
Original Mortgage
$270,000
Interest Rate
4.91%
Mortgage Type
Reverse Mortgage Home Equity Conversion Mortgage
Purchase Details
Closed on
Mar 19, 2001
Sold by
Blankenship Lou Kathrin
Bought by
Blankenship Lou Kathrin
Purchase Details
Closed on
Dec 27, 2000
Sold by
Blankenship Lou Kathrin
Bought by
Blankenship Lou Kathrin
Create a Home Valuation Report for This Property
The Home Valuation Report is an in-depth analysis detailing your home's value as well as a comparison with similar homes in the area
Purchase History
| Date | Buyer | Sale Price | Title Company |
|---|---|---|---|
| Kathryn T Worsham Trust | -- | -- | |
| Blankenship Lou Kathrin | -- | None Available | |
| Blankenship Lou Kathrin | -- | Fidelity Natl Title Co Of Ca | |
| Blankenship Lou Kathrin | -- | -- | |
| Blankenship Lou Kathrin | -- | -- | |
| Blankenship Lou Kathrin | -- | -- | |
| Blankenship Lou Kathrin | -- | -- | |
| Blankenship Lou Kathrin | -- | -- | |
| Blankenship Lou Kathrin | -- | -- |
Source: Public Records
Mortgage History
| Date | Status | Borrower | Loan Amount |
|---|---|---|---|
| Previous Owner | Blankenship Lou Kathrin | $270,000 |
Source: Public Records
Tax History
| Year | Tax Paid | Tax Assessment Tax Assessment Total Assessment is a certain percentage of the fair market value that is determined by local assessors to be the total taxable value of land and additions on the property. | Land | Improvement |
|---|---|---|---|---|
| 2025 | $651 | $69,733 | $10,673 | $59,060 |
| 2023 | $637 | $67,026 | $10,259 | $56,767 |
| 2022 | $627 | $65,712 | $10,058 | $55,654 |
| 2021 | $602 | $64,424 | $9,861 | $54,563 |
| 2020 | $608 | $63,764 | $9,760 | $54,004 |
| 2019 | $582 | $62,515 | $9,569 | $52,946 |
| 2018 | $581 | $61,290 | $9,382 | $51,908 |
| 2017 | $576 | $60,090 | $9,199 | $50,891 |
| 2016 | $536 | $58,913 | $9,019 | $49,894 |
| 2015 | $532 | $58,029 | $8,884 | $49,145 |
| 2014 | $521 | $56,893 | $8,710 | $48,183 |
Source: Public Records
Map
Nearby Homes
Your Personal Tour Guide
Ask me questions while you tour the home.