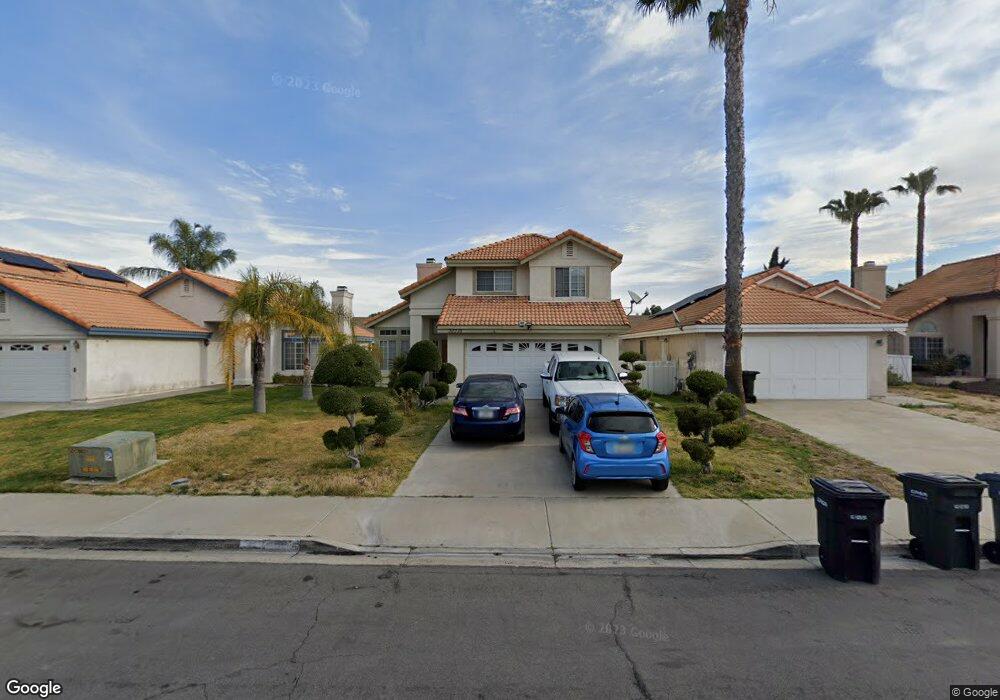
30316 Pechanga Dr Temecula, CA 92592
Estimated Value: $580,000 - $637,000
3
Beds
3
Baths
1,289
Sq Ft
$471/Sq Ft
Est. Value
About This Home
This home is located at 30316 Pechanga Dr, Temecula, CA 92592 and is currently estimated at $606,641, approximately $470 per square foot. 30316 Pechanga Dr is a home located in Riverside County with nearby schools including Red Hawk Elementary, Erle Stanley Gardner Middle School, and Great Oak High School.
Ownership History
Date
Name
Owned For
Owner Type
Purchase Details
Closed on
Aug 29, 1997
Sold by
Street Cynthia A and Street Sidney Mayo
Bought by
Alegria Pedro M and Alegria Maria L
Current Estimated Value
Home Financials for this Owner
Home Financials are based on the most recent Mortgage that was taken out on this home.
Original Mortgage
$107,618
Outstanding Balance
$16,649
Interest Rate
7.45%
Mortgage Type
FHA
Estimated Equity
$589,992
Purchase Details
Closed on
Sep 5, 1995
Sold by
Street David M
Bought by
Street Cynthia A
Home Financials for this Owner
Home Financials are based on the most recent Mortgage that was taken out on this home.
Original Mortgage
$92,280
Interest Rate
7.63%
Mortgage Type
FHA
Purchase Details
Closed on
Aug 24, 1995
Sold by
Cusi Ernest C and Cusi Evelina A
Bought by
Street Cynthia Ann and Mayo Stillman Sidney
Home Financials for this Owner
Home Financials are based on the most recent Mortgage that was taken out on this home.
Original Mortgage
$92,280
Interest Rate
7.63%
Mortgage Type
FHA
Create a Home Valuation Report for This Property
The Home Valuation Report is an in-depth analysis detailing your home's value as well as a comparison with similar homes in the area
Purchase History
| Date | Buyer | Sale Price | Title Company |
|---|---|---|---|
| Alegria Pedro M | $108,000 | First American Title Ins Co | |
| Street Cynthia A | -- | First American Title Ins Co | |
| Street Cynthia Ann | $105,000 | First American Title Ins Co |
Source: Public Records
Mortgage History
| Date | Status | Borrower | Loan Amount |
|---|---|---|---|
| Open | Alegria Pedro M | $107,618 | |
| Previous Owner | Street Cynthia Ann | $92,280 |
Source: Public Records
Tax History
| Year | Tax Paid | Tax Assessment Tax Assessment Total Assessment is a certain percentage of the fair market value that is determined by local assessors to be the total taxable value of land and additions on the property. | Land | Improvement |
|---|---|---|---|---|
| 2025 | $2,363 | $172,405 | $47,882 | $124,523 |
| 2023 | $2,363 | $165,713 | $46,024 | $119,689 |
| 2022 | $2,282 | $162,465 | $45,122 | $117,343 |
| 2021 | $2,228 | $159,281 | $44,238 | $115,043 |
| 2020 | $2,201 | $157,649 | $43,785 | $113,864 |
| 2019 | $2,167 | $154,559 | $42,927 | $111,632 |
| 2018 | $2,120 | $151,530 | $42,086 | $109,444 |
| 2017 | $2,080 | $148,560 | $41,261 | $107,299 |
| 2016 | $2,043 | $145,648 | $40,452 | $105,196 |
| 2015 | $2,005 | $143,463 | $39,846 | $103,617 |
| 2014 | $1,942 | $140,655 | $39,066 | $101,589 |
Source: Public Records
Map
Nearby Homes
- 44584 La Paz Rd
- 44557 La Paz Rd
- 30574 Greenway Cir
- 30752 Canterfield Dr
- 0 Old Town Front St Unit IV24092006
- 45610 Masters Dr
- 44921 Muirfield Dr
- 30230 De Portola Rd
- 45187 Via Vela
- 30932 Greensboro Dr
- 43845 Calle de Velardo
- 45763 Via Nubes
- 44891 Athel Way
- 45356 Via Nubes
- 31170 Strawberry Tree Ln Unit 67
- 31167 Strawberry Tree Ln
- 31271 Taylor Ln
- 31293 Taylor Ln
- 44921 Bellflower Ln Unit 111
- 43677 Calle de Velardo
- 30308 Pechanga Dr
- 30324 Pechanga Dr
- 30300 Pechanga Dr
- 30332 Pechanga Dr
- 30292 Pechanga Dr
- 30340 Pechanga Dr
- 30319 Pechanga Dr
- 30284 Pechanga Dr
- 30309 Pechanga Dr
- 30348 Pechanga Dr
- 30327 Pechanga Dr
- 30301 Pechanga Dr
- 30339 Pechanga Dr
- 30345 Pechanga Dr
- 30293 Pechanga Dr
- 30276 Pechanga Dr
- 30356 Pechanga Dr
- 30285 Pechanga Dr
- 30353 Pechanga Dr
- 30268 Pechanga Dr
Your Personal Tour Guide
Ask me questions while you tour the home.