3034 Grey Eagle Dr Unit 132 Walnut Creek, CA 94595
Rossmoor NeighborhoodEstimated Value: $1,769,000 - $2,354,000
3
Beds
2
Baths
2,216
Sq Ft
$910/Sq Ft
Est. Value
About This Home
This home is located at 3034 Grey Eagle Dr Unit 132, Walnut Creek, CA 94595 and is currently estimated at $2,016,022, approximately $909 per square foot. 3034 Grey Eagle Dr Unit 132 is a home located in Contra Costa County with nearby schools including Parkmead Elementary School, Walnut Creek Intermediate School, and Las Lomas High School.
Ownership History
Date
Name
Owned For
Owner Type
Purchase Details
Closed on
Feb 7, 2019
Sold by
Lim Brenda
Bought by
Lim Brenda
Current Estimated Value
Purchase Details
Closed on
Oct 3, 2006
Sold by
Laporta John J and Laporta La Porta
Bought by
Lim Samn and Lim Brenda
Purchase Details
Closed on
Mar 25, 2004
Sold by
Adams Thomas S and Adams Sally C
Bought by
Laporta John J and Laporta Helena
Home Financials for this Owner
Home Financials are based on the most recent Mortgage that was taken out on this home.
Original Mortgage
$400,000
Interest Rate
4.62%
Mortgage Type
Purchase Money Mortgage
Purchase Details
Closed on
Jul 8, 2003
Sold by
Bleier Ralph K
Bought by
Adams Thomas S and Adams Sally C
Purchase Details
Closed on
Jul 19, 2000
Sold by
Shea Homes Inc
Bought by
Bleier Jeanette G and Bleier Ralph K
Create a Home Valuation Report for This Property
The Home Valuation Report is an in-depth analysis detailing your home's value as well as a comparison with similar homes in the area
Home Values in the Area
Average Home Value in this Area
Purchase History
| Date | Buyer | Sale Price | Title Company |
|---|---|---|---|
| Lim Brenda | -- | None Available | |
| Lim Samn | $1,262,500 | North American Title Co | |
| Laporta John J | $1,160,000 | North American Title | |
| Adams Thomas S | $990,000 | North American Title | |
| Bleier Jeanette G | $635,000 | First American Title Guarant |
Source: Public Records
Mortgage History
| Date | Status | Borrower | Loan Amount |
|---|---|---|---|
| Previous Owner | Laporta John J | $400,000 |
Source: Public Records
Tax History
| Year | Tax Paid | Tax Assessment Tax Assessment Total Assessment is a certain percentage of the fair market value that is determined by local assessors to be the total taxable value of land and additions on the property. | Land | Improvement |
|---|---|---|---|---|
| 2025 | $19,394 | $1,682,763 | $1,125,417 | $557,346 |
| 2024 | $18,728 | $1,649,768 | $1,103,350 | $546,418 |
| 2023 | $18,728 | $1,617,420 | $1,081,716 | $535,704 |
| 2022 | $18,347 | $1,585,706 | $1,060,506 | $525,200 |
| 2021 | $17,844 | $1,554,614 | $1,039,712 | $514,902 |
| 2019 | $17,536 | $1,508,506 | $1,008,875 | $499,631 |
| 2018 | $16,982 | $1,478,929 | $989,094 | $489,835 |
| 2017 | $15,629 | $1,350,000 | $902,867 | $447,133 |
| 2016 | $15,620 | $1,350,000 | $902,867 | $447,133 |
| 2015 | $15,488 | $1,350,000 | $902,867 | $447,133 |
| 2014 | $13,423 | $1,150,000 | $769,109 | $380,891 |
Source: Public Records
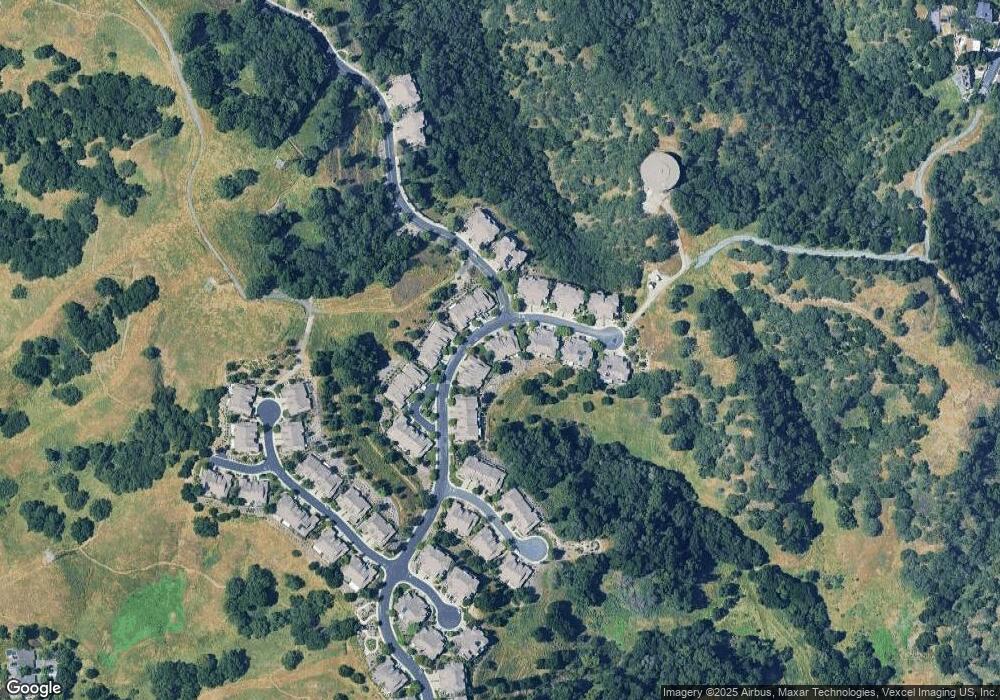
Map
Nearby Homes
- 2994 Saklan Indian Dr Unit 172
- 3126 Grey Eagle Dr
- 539 High Eagle Ct
- 2886 Saklan Indian Dr Unit 198
- 501 Falconwood Ct
- 5401 Terra Granada Dr Unit 1B
- 5413 Terra Granada Dr Unit 3A
- 5301 Terra Granada Dr Unit 2A
- 3210 Rossmoor Pkwy Unit 4
- 5201 Terra Granada Dr Unit 2B
- 289 Castle Crest Rd
- 3136 Rossmoor Pkwy Unit 6
- 3050 Rossmoor Pkwy Unit 3
- 2844 Saklan Indian Dr Unit 220
- 3410 Tice Creek Dr Unit 8
- 0 Castle Crest Rd
- 4033 Terra Granada Dr Unit 9C
- 1221 Avenida Sevilla Unit 1B
- 283 Castle Hill Ranch Rd
- 4001 Terra Granada Dr Unit 1A
- 3032 Grey Eagle Dr Unit 1
- 3032 Grey Eagle Dr Unit 133
- 3044 Grey Eagle Dr
- 3026 Grey Eagle Dr
- 3046 Grey Eagle Dr Unit 130
- 3033 Grey Eagle Dr
- 3033 Grey Eagle Dr Unit 144
- 3035 Grey Eagle Dr Unit 143
- 3031 Grey Eagle Dr Unit 145
- 3022 Grey Eagle Dr Unit 149
- 3024 Grey Eagle Dr Unit 148
- 3041 Grey Eagle Dr
- 3041 Grey Eagle Dr Unit 142
- 3025 Grey Eagle Dr
- 3043 Grey Eagle Dr Unit 141
- 3023 Grey Eagle Dr
- 3062 Grey Eagle Dr
- 3027 Grey Eagle Dr
- 3047 Grey Eagle Dr Unit 140
- 3021 Grey Eagle Dr Unit 167
Your Personal Tour Guide
Ask me questions while you tour the home.