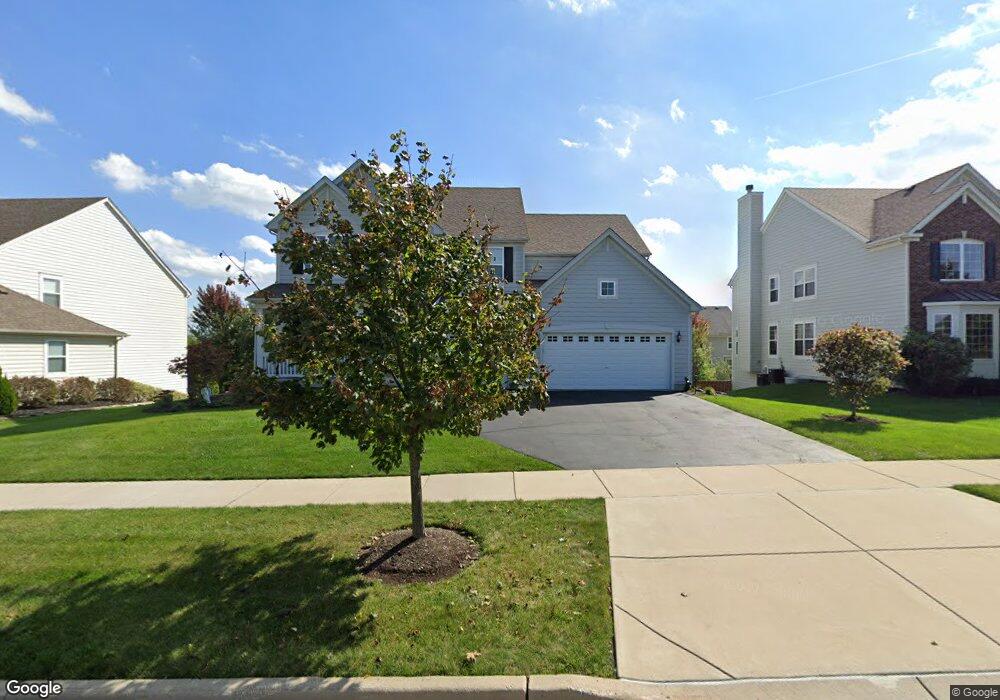
3035 Range Rd Elgin, IL 60124
Providence NeighborhoodEstimated Value: $526,000 - $581,000
4
Beds
3
Baths
3,106
Sq Ft
$179/Sq Ft
Est. Value
About This Home
This home is located at 3035 Range Rd, Elgin, IL 60124 and is currently estimated at $554,609, approximately $178 per square foot. 3035 Range Rd is a home located in Kane County with nearby schools including Prairie View Grade School, Prairie Knolls Middle School, and Central Middle School.
Ownership History
Date
Name
Owned For
Owner Type
Purchase Details
Closed on
Sep 17, 2021
Sold by
Voltz Barry and Voltz Tina M
Bought by
Voltz Barry and Voltz Tina M
Current Estimated Value
Purchase Details
Closed on
Dec 19, 2007
Sold by
Sopoci Joel D and Sopoci Tracy L
Bought by
Voltz Barry and Voltz Tina M
Home Financials for this Owner
Home Financials are based on the most recent Mortgage that was taken out on this home.
Original Mortgage
$221,000
Interest Rate
6.13%
Mortgage Type
Purchase Money Mortgage
Purchase Details
Closed on
Sep 13, 2007
Sold by
The Ryland Group Inc
Bought by
Sopoci Joel D and Sopoci Tracy L
Home Financials for this Owner
Home Financials are based on the most recent Mortgage that was taken out on this home.
Original Mortgage
$350,330
Interest Rate
6.49%
Mortgage Type
Purchase Money Mortgage
Create a Home Valuation Report for This Property
The Home Valuation Report is an in-depth analysis detailing your home's value as well as a comparison with similar homes in the area
Home Values in the Area
Average Home Value in this Area
Purchase History
| Date | Buyer | Sale Price | Title Company |
|---|---|---|---|
| Voltz Barry | -- | None Listed On Document | |
| Voltz Barry | $350,000 | Attorneys Title Guaranty Fun | |
| Sopoci Joel D | $369,000 | Ryland Title Company |
Source: Public Records
Mortgage History
| Date | Status | Borrower | Loan Amount |
|---|---|---|---|
| Previous Owner | Voltz Barry | $221,000 | |
| Previous Owner | Sopoci Joel D | $350,330 |
Source: Public Records
Tax History
| Year | Tax Paid | Tax Assessment Tax Assessment Total Assessment is a certain percentage of the fair market value that is determined by local assessors to be the total taxable value of land and additions on the property. | Land | Improvement |
|---|---|---|---|---|
| 2024 | $13,848 | $163,084 | $27,638 | $135,446 |
| 2023 | $13,231 | $147,520 | $25,000 | $122,520 |
| 2022 | $11,625 | $125,917 | $21,357 | $104,560 |
| 2021 | $11,172 | $116,837 | $20,633 | $96,204 |
| 2020 | $11,176 | $114,737 | $20,262 | $94,475 |
| 2019 | $11,243 | $112,103 | $20,000 | $92,103 |
| 2018 | $11,075 | $109,475 | $22,771 | $86,704 |
| 2017 | $11,029 | $107,198 | $22,194 | $85,004 |
| 2016 | $11,100 | $100,286 | $21,667 | $78,619 |
| 2015 | -- | $88,411 | $14,747 | $73,664 |
| 2014 | -- | $84,316 | $14,747 | $69,569 |
| 2013 | -- | $87,571 | $14,999 | $72,572 |
Source: Public Records
Map
Nearby Homes
- 313 Monument Rd
- 282 Snow Drop Ln
- 284 Snowdrop Ln
- 280 Snow Drop Ln
- 274 Snow Drop Ln
- 272 Snow Drop Ln
- 289 Snow Drop Ln
- 285 Snowdrop Ln
- 270 Snow Drop Ln
- 283 Snow Drop Ln
- 278 Snowdrop Ln
- 281 Snowdrop Ln
- 266 Snowdrop Ln
- 264 Snow Drop Ln
- 283 Snowdrop Ln
- 289 Snowdrop Ln
- 11N215 Capulet Cir
- 310 Astor Ct
- 411 Hopkins Ave
- 3311 Lafayette St
Your Personal Tour Guide
Ask me questions while you tour the home.