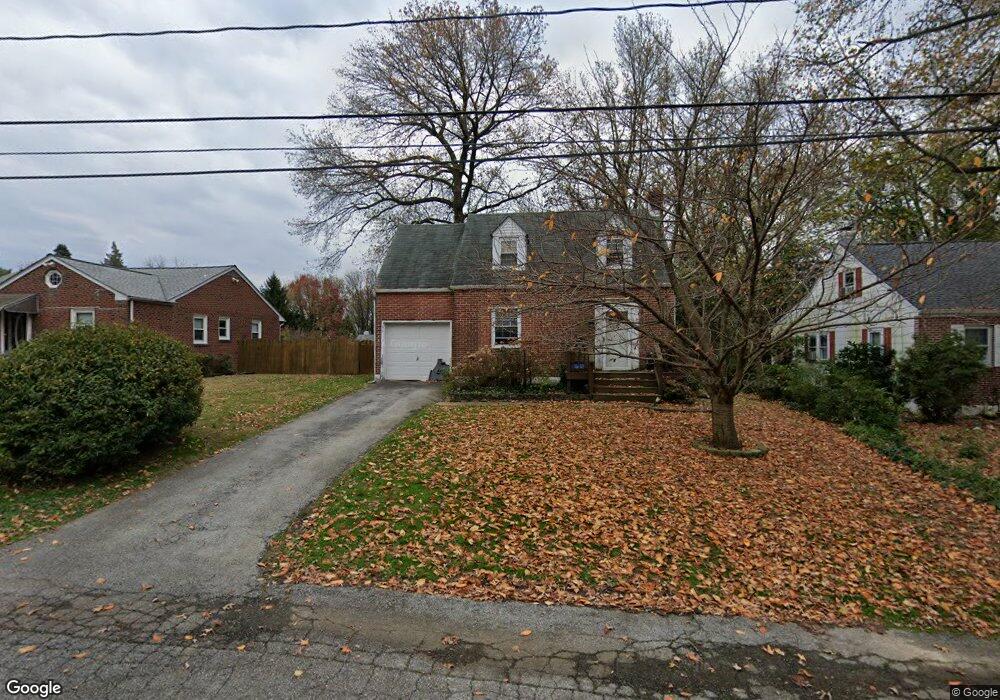
304 Channel Rd Wilmington, DE 19809
Estimated Value: $269,000 - $360,000
3
Beds
1
Bath
1,200
Sq Ft
$256/Sq Ft
Est. Value
About This Home
This home is located at 304 Channel Rd, Wilmington, DE 19809 and is currently estimated at $306,938, approximately $255 per square foot. 304 Channel Rd is a home located in New Castle County with nearby schools including Mount Pleasant Elementary School, Pierre S. Dupont Middle School, and Mount Pleasant High School.
Ownership History
Date
Name
Owned For
Owner Type
Purchase Details
Closed on
Oct 17, 2008
Sold by
Smith Dawna J and Warwick Joshua P
Bought by
Farley James J and Mccomb Ann M
Current Estimated Value
Home Financials for this Owner
Home Financials are based on the most recent Mortgage that was taken out on this home.
Original Mortgage
$130,000
Outstanding Balance
$86,364
Interest Rate
6.41%
Mortgage Type
Purchase Money Mortgage
Estimated Equity
$220,574
Purchase Details
Closed on
Jun 23, 2006
Sold by
Clagg Donald G and Doubet Bernadette F
Bought by
Smith Dawna J and Warwick Joshua P
Home Financials for this Owner
Home Financials are based on the most recent Mortgage that was taken out on this home.
Original Mortgage
$227,204
Interest Rate
6.6%
Mortgage Type
FHA
Purchase Details
Closed on
Nov 18, 2004
Sold by
Copeland James B and Copeland Tracy
Bought by
Clagg Donald G and Doubet Bernadette F
Home Financials for this Owner
Home Financials are based on the most recent Mortgage that was taken out on this home.
Original Mortgage
$171,593
Interest Rate
5.8%
Mortgage Type
Purchase Money Mortgage
Create a Home Valuation Report for This Property
The Home Valuation Report is an in-depth analysis detailing your home's value as well as a comparison with similar homes in the area
Home Values in the Area
Average Home Value in this Area
Purchase History
| Date | Buyer | Sale Price | Title Company |
|---|---|---|---|
| Farley James J | $200,000 | None Available | |
| Smith Dawna J | $229,000 | None Available | |
| Clagg Donald G | $88,450 | -- |
Source: Public Records
Mortgage History
| Date | Status | Borrower | Loan Amount |
|---|---|---|---|
| Open | Farley James J | $130,000 | |
| Previous Owner | Smith Dawna J | $227,204 | |
| Previous Owner | Clagg Donald G | $171,593 |
Source: Public Records
Tax History Compared to Growth
Tax History
| Year | Tax Paid | Tax Assessment Tax Assessment Total Assessment is a certain percentage of the fair market value that is determined by local assessors to be the total taxable value of land and additions on the property. | Land | Improvement |
|---|---|---|---|---|
| 2024 | $2,225 | $57,000 | $9,500 | $47,500 |
| 2023 | $2,039 | $57,000 | $9,500 | $47,500 |
| 2022 | $2,063 | $57,000 | $9,500 | $47,500 |
| 2021 | $2,062 | $57,000 | $9,500 | $47,500 |
| 2020 | $2,061 | $57,000 | $9,500 | $47,500 |
| 2019 | $3,263 | $57,000 | $9,500 | $47,500 |
| 2018 | $1,972 | $57,000 | $9,500 | $47,500 |
| 2017 | $1,942 | $57,000 | $9,500 | $47,500 |
| 2016 | $1,938 | $57,000 | $9,500 | $47,500 |
| 2015 | $1,785 | $57,000 | $9,500 | $47,500 |
| 2014 | $1,785 | $57,000 | $9,500 | $47,500 |
Source: Public Records
Map
Nearby Homes
- 1100 Lore Ave Unit 509
- 302 River Rd Unit D8
- 17 S Rodney Dr
- 5207 Le Parc Dr Unit 8
- 47 N Pennewell Dr
- 5215 Le Parc Dr Unit 2
- 5219 Le Parc Dr Unit 2
- 1107 Haines Ave
- 18 S Pennewell Dr
- 304 Chestnut Ave
- 1103 Melrose Ave
- 402 Grove Ave
- 5 Blue Rock Rd
- 523 Governor House Cir Unit 50
- 6201 Highland Ct Unit 6201
- 731 Governor House Cir Unit 74
- 705 Phillips Ave
- 1213 Talley Rd
- 8506 Park Ct Unit 8506
- 1507 Spring Ln
- 300 Channel Rd
- 306 Channel Rd
- 303 Andross Rd
- 1403 Haines Ave
- 1401 Haines Ave
- 301 Andross Rd
- 1405 Haines Ave
- 305 Andross Rd
- 1407 Haines Ave
- 310 Channel Rd
- 303 Channel Rd
- 305 Channel Rd
- 1311 Haines Ave
- 1409 Haines Ave
- 307 Channel Rd
- 1309 Haines Ave
- 309 Channel Rd
- 1402 Haines Ave
- 1400 Haines Ave
- 1400 Lore Ave