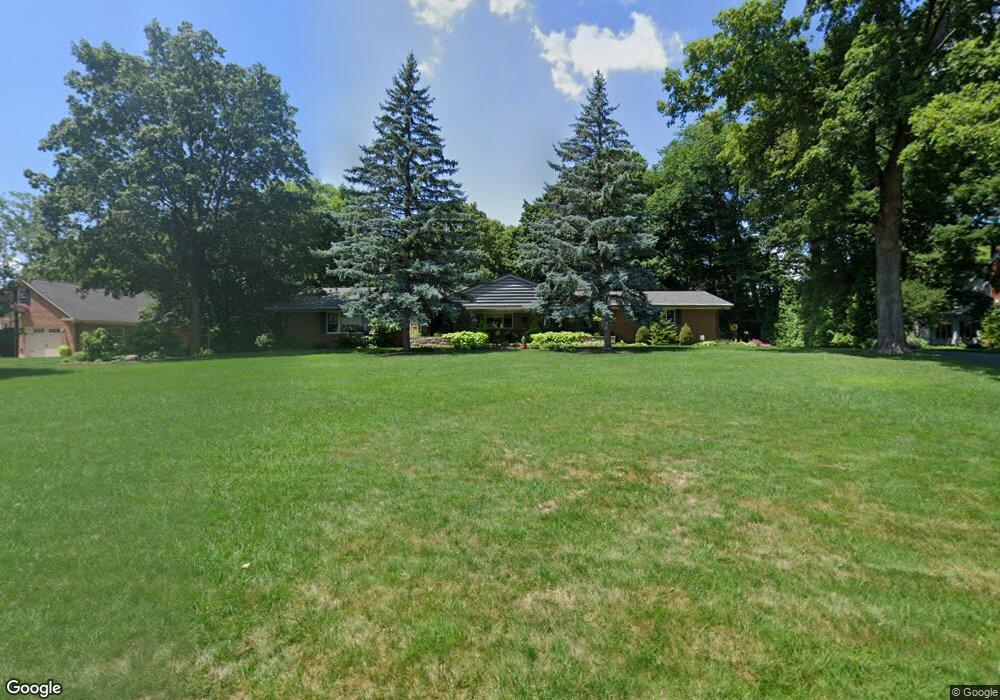
3049 Ridgeway Rd Dayton, OH 45419
Estimated Value: $445,000 - $550,000
4
Beds
4
Baths
2,777
Sq Ft
$180/Sq Ft
Est. Value
About This Home
This home is located at 3049 Ridgeway Rd, Dayton, OH 45419 and is currently estimated at $500,471, approximately $180 per square foot. 3049 Ridgeway Rd is a home located in Montgomery County with nearby schools including Southdale Elementary School, Van Buren Middle School, and Kettering Fairmont High School.
Ownership History
Date
Name
Owned For
Owner Type
Purchase Details
Closed on
May 26, 2021
Sold by
Vogel Richard C and Vogel Nancy A
Bought by
Vogel Richard C and Vogel Nancy A
Current Estimated Value
Purchase Details
Closed on
May 2, 2013
Sold by
Smith Barbara A and Morrow Gary W
Bought by
Vogel Richard C and Vogel Nancy A
Home Financials for this Owner
Home Financials are based on the most recent Mortgage that was taken out on this home.
Original Mortgage
$85,000
Interest Rate
3.99%
Mortgage Type
Adjustable Rate Mortgage/ARM
Purchase Details
Closed on
Oct 28, 1999
Sold by
Campbell Gladys B
Bought by
Morrow Gary W and Smith Barbara A
Home Financials for this Owner
Home Financials are based on the most recent Mortgage that was taken out on this home.
Original Mortgage
$240,000
Interest Rate
7.78%
Create a Home Valuation Report for This Property
The Home Valuation Report is an in-depth analysis detailing your home's value as well as a comparison with similar homes in the area
Home Values in the Area
Average Home Value in this Area
Purchase History
| Date | Buyer | Sale Price | Title Company |
|---|---|---|---|
| Vogel Richard C | -- | None Available | |
| Vogel Richard C | $305,000 | Sterling Title Inc | |
| Morrow Gary W | $310,000 | -- |
Source: Public Records
Mortgage History
| Date | Status | Borrower | Loan Amount |
|---|---|---|---|
| Closed | Vogel Richard C | $85,000 | |
| Closed | Morrow Gary W | $240,000 | |
| Closed | Morrow Gary W | $39,000 |
Source: Public Records
Tax History Compared to Growth
Tax History
| Year | Tax Paid | Tax Assessment Tax Assessment Total Assessment is a certain percentage of the fair market value that is determined by local assessors to be the total taxable value of land and additions on the property. | Land | Improvement |
|---|---|---|---|---|
| 2024 | $8,832 | $142,710 | $39,810 | $102,900 |
| 2023 | $8,832 | $142,710 | $39,810 | $102,900 |
| 2022 | $8,723 | $111,490 | $31,100 | $80,390 |
| 2021 | $8,066 | $111,490 | $31,100 | $80,390 |
| 2020 | $8,090 | $111,490 | $31,100 | $80,390 |
| 2019 | $9,038 | $110,170 | $29,620 | $80,550 |
| 2018 | $9,087 | $110,170 | $29,620 | $80,550 |
| 2017 | $8,367 | $110,170 | $29,620 | $80,550 |
| 2016 | $7,707 | $95,320 | $29,620 | $65,700 |
| 2015 | $7,339 | $95,320 | $29,620 | $65,700 |
| 2014 | $7,339 | $95,040 | $29,620 | $65,420 |
| 2012 | -- | $82,040 | $29,620 | $52,420 |
Source: Public Records
Map
Nearby Homes
- 311 Parkdale St Unit 309
- 321 E Dorothy Ln
- 548 Winding Way
- 3325 Ridgeway Rd
- 3212 Lenox Dr
- 927 Cottonwood Rd
- 101 Blue Gate Cir Unit 1
- 3101 Allendale Dr
- 2420 Ridgeway Rd
- 117 Cushing Ave
- 209 Brydon Rd
- 59 Alpine Ln
- 233 E Dorothy Ln
- 309 Lewiston Rd
- 1151 Brookview Ave
- 320 E Dorothy Ln
- 1125 Laurelwood Rd
- 320 Brydon Rd
- 2101 Far Hills Ave
- 115 N Bromfield Rd
- 3073 Ridgeway Rd
- 3025 Ridgeway Rd
- 3074 Ridgeway Rd
- 3050 Ridgeway Rd
- 3026 Ridgeway Rd
- 3001 Ridgeway Rd
- 533 Canterbury Dr
- 3125 Ridgeway Rd
- 3000 Big Hill Rd
- 3100 Ridgeway Rd
- 2990 Big Hill Rd
- 3018 Big Hill Rd
- 3097 Hillside Ave
- 3089 Hillside Ave
- 3000 Ridgeway Rd
- 3081 Hillside Ave
- 501 Avon Way
- 3073 Hillside Ave
- 532 Canterbury Dr
- 3124 Ridgeway Rd