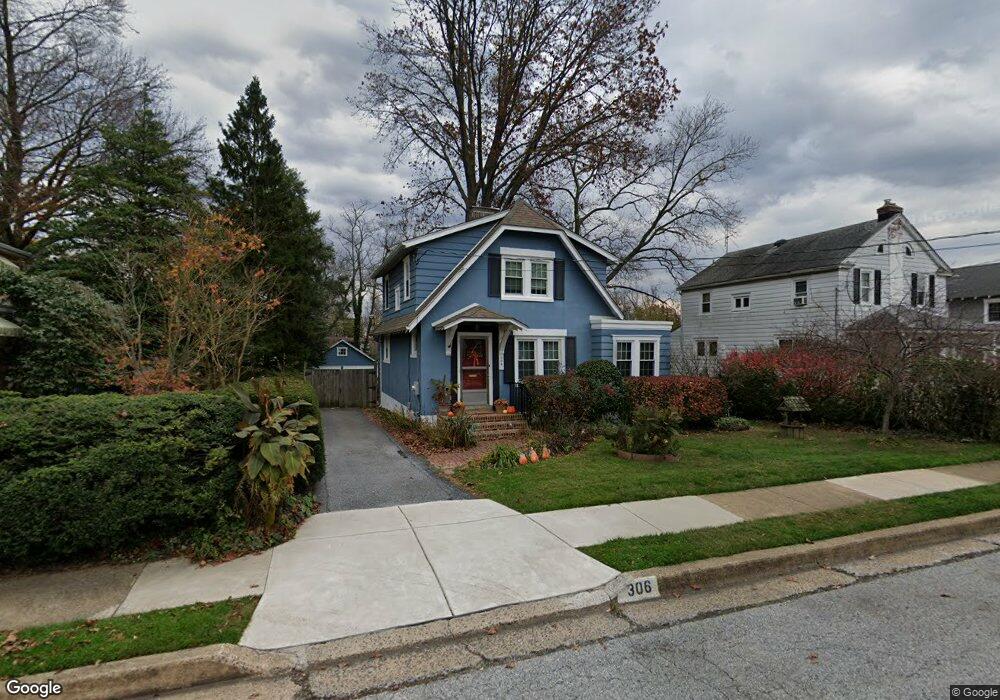
306 Brandywine Blvd Wilmington, DE 19809
Estimated Value: $253,000 - $334,000
3
Beds
1
Bath
1,400
Sq Ft
$223/Sq Ft
Est. Value
About This Home
This home is located at 306 Brandywine Blvd, Wilmington, DE 19809 and is currently estimated at $312,055, approximately $222 per square foot. 306 Brandywine Blvd is a home located in New Castle County with nearby schools including Mount Pleasant Elementary School, Pierre S. Dupont Middle School, and Mount Pleasant High School.
Ownership History
Date
Name
Owned For
Owner Type
Purchase Details
Closed on
Apr 2, 2021
Sold by
Jumps Cheryl D and Cheryl D Jumps Revocable Trust
Bought by
Jumps Cheryl D and Cheryl D Jumps Revocable Trust
Current Estimated Value
Home Financials for this Owner
Home Financials are based on the most recent Mortgage that was taken out on this home.
Original Mortgage
$121,050
Interest Rate
2.9%
Mortgage Type
New Conventional
Purchase Details
Closed on
Feb 17, 2014
Sold by
Jumps Doug and Jumps Cheryl
Bought by
Jumps Cheryl D and Cheryl D Jumps Revocable Trust
Purchase Details
Closed on
Mar 9, 2011
Sold by
Barker Cheryl D and Jumps Cheryl
Bought by
Jumps Cheryl and Jumps Doug
Home Financials for this Owner
Home Financials are based on the most recent Mortgage that was taken out on this home.
Original Mortgage
$139,800
Interest Rate
4.84%
Mortgage Type
New Conventional
Purchase Details
Closed on
Jun 10, 2005
Sold by
Barker Dale E and Barker Cheryl D
Bought by
Barker Cheryl D
Create a Home Valuation Report for This Property
The Home Valuation Report is an in-depth analysis detailing your home's value as well as a comparison with similar homes in the area
Home Values in the Area
Average Home Value in this Area
Purchase History
We collect this data history from publicly available records. To have your information removed, we recommend requesting removal directly through your county’s website.
| Date | Buyer | Sale Price | Title Company |
|---|---|---|---|
| Jumps Cheryl D | -- | Title365 | |
| Jumps Cheryl D | -- | None Available | |
| Jumps Cheryl | -- | Global Title Inc | |
| Barker Cheryl D | -- | -- |
Source: Public Records
Mortgage History
We collect this data history from publicly available records. To have your information removed, we recommend requesting removal directly through your county’s website.
| Date | Status | Borrower | Loan Amount |
|---|---|---|---|
| Closed | Jumps Cheryl D | $121,050 | |
| Closed | Jumps Cheryl | $139,800 |
Source: Public Records
Tax History
| Year | Tax Paid | Tax Assessment Tax Assessment Total Assessment is a certain percentage of the fair market value that is determined by local assessors to be the total taxable value of land and additions on the property. | Land | Improvement |
|---|---|---|---|---|
| 2025 | $2,053 | $328,300 | $77,400 | $250,900 |
| 2024 | $1,733 | $57,200 | $10,200 | $47,000 |
| 2023 | $1,546 | $57,200 | $10,200 | $47,000 |
| 2022 | $1,570 | $57,200 | $10,200 | $47,000 |
| 2021 | $1,669 | $57,200 | $10,200 | $47,000 |
| 2020 | $1,668 | $57,200 | $10,200 | $47,000 |
| 2019 | $2,513 | $57,200 | $10,200 | $47,000 |
| 2018 | $1,979 | $57,200 | $10,200 | $47,000 |
| 2017 | $1,949 | $57,200 | $10,200 | $47,000 |
| 2016 | $1,945 | $57,200 | $10,200 | $47,000 |
| 2015 | $1,792 | $57,200 | $10,200 | $47,000 |
| 2014 | $1,791 | $57,200 | $10,200 | $47,000 |
Source: Public Records
Map
Nearby Homes
- 202 Blue Rock Rd
- 103 South Rd
- 47 N Pennewell Dr
- 29 Beekman Rd
- 302 River Rd Unit D8
- 402 Grove Ave
- 405 Hillcrest Ave
- 205 Edgewood Dr
- 910 Marion Ave
- 902 Grandview Ave
- 504 Springhill Ave
- 7905 Pleasant Ct Unit 7905
- 7303 Pleasant Ct Unit 7303
- 408 Marsh Rd
- 9 Wier Ave
- 1117 Talley Rd
- 1122 Talley Rd
- 1400 Haines Ave
- 130 Paladin Dr
- 76 Paladin Dr
- 304 Brandywine Blvd
- 308 Brandywine Blvd
- 302 Brandywine Blvd
- 903 Haines Ave
- 300 Brandywine Blvd
- 905 Haines Ave
- 305 Lighthouse Rd
- 311 Lighthouse Rd
- 303 Brandywine Blvd
- 303 Lighthouse Rd
- 309 Brandywine Blvd
- 313 Lighthouse Rd
- 811 Haines Ave
- 909 Haines Ave
- 305 Brandywine Blvd
- 206 Brandywine Blvd
- 807 Haines Ave
- 902 Haines Ave
- 600 Lore Ave
- 316 Brandywine Blvd
Your Personal Tour Guide
Ask me questions while you tour the home.