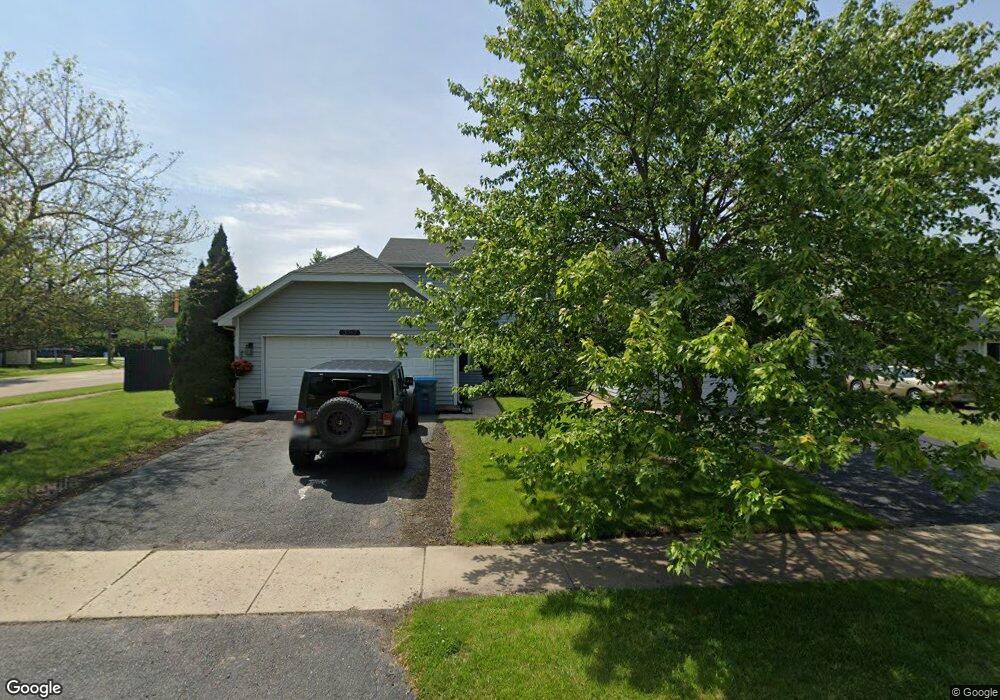
3067 Winchester Ct W Unit 18B Aurora, IL 60504
South East Village NeighborhoodEstimated Value: $241,000 - $289,336
3
Beds
2
Baths
1,194
Sq Ft
$217/Sq Ft
Est. Value
About This Home
This home is located at 3067 Winchester Ct W Unit 18B, Aurora, IL 60504 and is currently estimated at $259,334, approximately $217 per square foot. 3067 Winchester Ct W Unit 18B is a home located in DuPage County with nearby schools including Georgetown Elementary School, Fischer Middle School, and Waubonsie Valley High School.
Ownership History
Date
Name
Owned For
Owner Type
Purchase Details
Closed on
Oct 19, 2011
Sold by
Fannie Mae
Bought by
Robles Juan
Current Estimated Value
Home Financials for this Owner
Home Financials are based on the most recent Mortgage that was taken out on this home.
Original Mortgage
$90,642
Outstanding Balance
$61,792
Interest Rate
4.09%
Mortgage Type
FHA
Estimated Equity
$197,542
Purchase Details
Closed on
Feb 15, 2011
Sold by
Fidai Anwer
Bought by
Federal National Mortgage Association
Purchase Details
Closed on
Nov 21, 2005
Sold by
Bebo Phillip and Bebo Mary Ann
Bought by
Fidal Anwer
Home Financials for this Owner
Home Financials are based on the most recent Mortgage that was taken out on this home.
Original Mortgage
$171,500
Interest Rate
6.17%
Mortgage Type
Fannie Mae Freddie Mac
Purchase Details
Closed on
Jun 28, 1994
Sold by
Paustian William J and Paustian Cheryl C
Bought by
Bebo Phillip and Bebo Mary Ann
Home Financials for this Owner
Home Financials are based on the most recent Mortgage that was taken out on this home.
Original Mortgage
$76,800
Interest Rate
8.61%
Mortgage Type
Purchase Money Mortgage
Create a Home Valuation Report for This Property
The Home Valuation Report is an in-depth analysis detailing your home's value as well as a comparison with similar homes in the area
Home Values in the Area
Average Home Value in this Area
Purchase History
| Date | Buyer | Sale Price | Title Company |
|---|---|---|---|
| Robles Juan | $93,000 | First American Title | |
| Federal National Mortgage Association | -- | None Available | |
| Fidal Anwer | $171,500 | Law Title | |
| Bebo Phillip | $96,000 | -- |
Source: Public Records
Mortgage History
| Date | Status | Borrower | Loan Amount |
|---|---|---|---|
| Open | Robles Juan | $90,642 | |
| Previous Owner | Fidal Anwer | $171,500 | |
| Previous Owner | Bebo Phillip | $76,800 |
Source: Public Records
Tax History Compared to Growth
Tax History
| Year | Tax Paid | Tax Assessment Tax Assessment Total Assessment is a certain percentage of the fair market value that is determined by local assessors to be the total taxable value of land and additions on the property. | Land | Improvement |
|---|---|---|---|---|
| 2024 | $4,580 | $68,232 | $16,894 | $51,338 |
| 2023 | $4,332 | $61,310 | $15,180 | $46,130 |
| 2022 | $4,289 | $57,140 | $14,030 | $43,110 |
| 2021 | $4,165 | $55,100 | $13,530 | $41,570 |
| 2020 | $4,216 | $55,100 | $13,530 | $41,570 |
| 2019 | $4,054 | $52,410 | $12,870 | $39,540 |
| 2018 | $3,075 | $40,810 | $9,940 | $30,870 |
| 2017 | $2,794 | $37,010 | $9,010 | $28,000 |
| 2016 | $2,730 | $35,520 | $8,650 | $26,870 |
| 2015 | $2,681 | $33,720 | $8,210 | $25,510 |
| 2014 | $2,594 | $32,040 | $7,750 | $24,290 |
| 2013 | $2,570 | $32,260 | $7,800 | $24,460 |
Source: Public Records
Map
Nearby Homes
- 2860 Bridgeport Ln Unit 19D
- 1465 Bridgeport Ln Unit 19D
- 1335 Lawrence Ct
- 1334 Normantown Rd Unit 334
- 3290 Johnsbury Ct
- 3144 Johnsbury Ln
- 2730 Dorothy Dr Unit 1
- 2632 Emma Cir
- 3479 Charlemaine Dr
- 3467 Charlemaine Dr
- 2723 Rosehall Ln
- 3437 Charlemaine Dr
- 2476 Village Ct Unit 2
- 2509 Rosehall Ln
- 2901 Shelly Ln
- 2950 Shelly Ln Unit 2950
- 703 Avondale Ln
- 2489 Rosehall Ln
- 2750 Shelly Ln
- 3185 Ketch Ct Unit 606
- 3065 Winchester Ct W Unit 18B
- 3063 Winchester Ct W
- 3100 Winchester Ct E
- 3061 Winchester Ct W
- 3059 Winchester Ct W
- 3068 Winchester Ct W
- 3066 Winchester Ct W Unit 18B
- 3057 Winchester Ct W
- 3110 Winchester Ct E Unit 17B
- 3064 Winchester Ct W Unit 18B
- 3105 Winchester Ct E Unit 17B
- 3062 Winchester Ct W
- 2990 Middlebury Ct W
- 3060 Winchester Ct W
- 3055 Winchester Ct W Unit 18B
- 3115 Winchester Ct E Unit 17B
- 3120 Winchester Ct E Unit 17B
- 2980 Middlebury Ct W
- 3000 Middlebury Ct E Unit 19B
- 3004 Middlebury Ct E Unit 19B