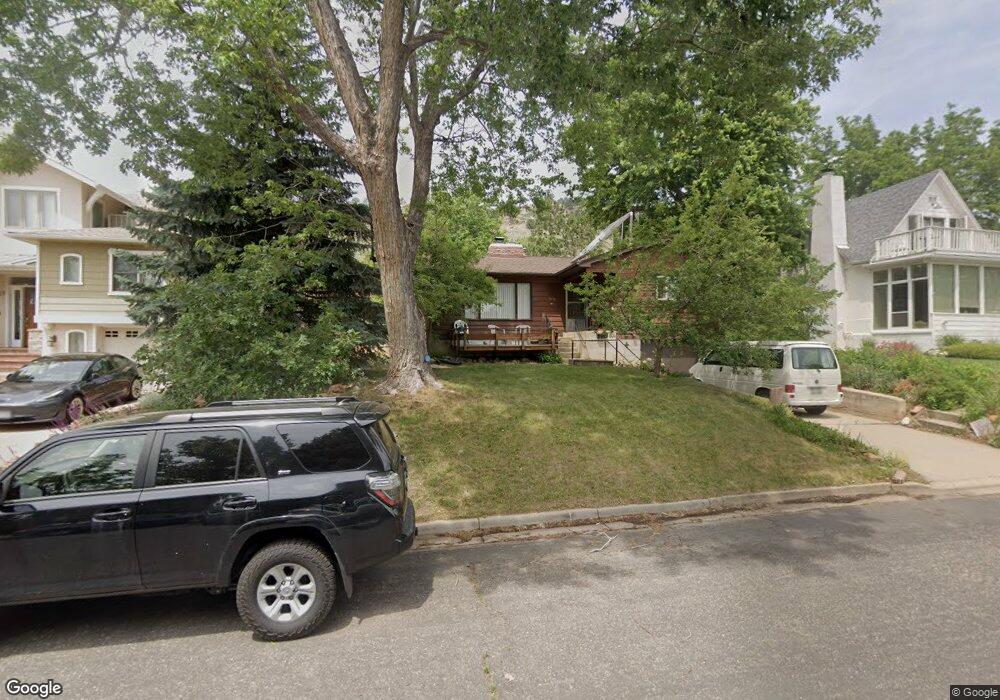
3075 5th St Boulder, CO 80304
Newlands NeighborhoodEstimated Value: $1,138,164 - $1,605,000
3
Beds
2
Baths
1,291
Sq Ft
$1,100/Sq Ft
Est. Value
About This Home
This home is located at 3075 5th St, Boulder, CO 80304 and is currently estimated at $1,420,291, approximately $1,100 per square foot. 3075 5th St is a home located in Boulder County with nearby schools including Foothill Elementary School, Casey Middle School, and Boulder High School.
Ownership History
Date
Name
Owned For
Owner Type
Purchase Details
Closed on
Jul 14, 2025
Sold by
Jugl Robin Birkeland
Bought by
Jugl John
Current Estimated Value
Purchase Details
Closed on
Jun 20, 2024
Sold by
Birkeland Suzanne J and Birkeland Suzanne Joyce
Bought by
Jugl Robin Birkeland
Purchase Details
Closed on
Nov 8, 2005
Sold by
Birkeland Peter W and Birkeland Suzanne J
Bought by
Birkeland Peter W
Purchase Details
Closed on
Jul 10, 1992
Bought by
Birkeland Peter W and Birkeland Suzanne J
Purchase Details
Closed on
Nov 2, 1967
Bought by
Birkeland Peter W and Birkeland Suzanne J
Create a Home Valuation Report for This Property
The Home Valuation Report is an in-depth analysis detailing your home's value as well as a comparison with similar homes in the area
Home Values in the Area
Average Home Value in this Area
Purchase History
| Date | Buyer | Sale Price | Title Company |
|---|---|---|---|
| Jugl John | -- | None Listed On Document | |
| Jugl Robin Birkeland | -- | None Listed On Document | |
| Birkeland Peter W | -- | -- | |
| Birkeland Peter W | -- | -- | |
| Birkeland Peter W | $19,000 | -- |
Source: Public Records
Tax History
| Year | Tax Paid | Tax Assessment Tax Assessment Total Assessment is a certain percentage of the fair market value that is determined by local assessors to be the total taxable value of land and additions on the property. | Land | Improvement |
|---|---|---|---|---|
| 2025 | $7,286 | $77,007 | $69,306 | $7,701 |
| 2024 | $7,286 | $77,007 | $69,306 | $7,701 |
| 2023 | $6,580 | $82,899 | $77,926 | $8,658 |
| 2022 | $5,383 | $64,920 | $58,428 | $6,492 |
| 2021 | $5,133 | $66,788 | $60,109 | $6,679 |
| 2020 | $4,676 | $60,868 | $48,692 | $12,176 |
| 2019 | $4,604 | $60,868 | $48,692 | $12,176 |
| 2018 | $4,003 | $53,366 | $42,696 | $10,670 |
| 2017 | $3,877 | $59,000 | $47,203 | $11,797 |
| 2016 | $3,798 | $51,836 | $41,472 | $10,364 |
| 2015 | $3,597 | $40,691 | $17,671 | $23,020 |
| 2014 | $2,752 | $40,691 | $17,671 | $23,020 |
Source: Public Records
Map
Nearby Homes
- 3033 3rd St
- 3015 3rd St
- 3189 5th St
- 300 Forest Ave
- 2958 6th St
- 3080 7th St
- 3056 8th St
- 503 Hawthorn Ave
- 515 Alpine Ave
- 865 Grape Ave Unit X
- 640 Iris Ave
- 711 Hawthorn Ave
- 2675 Dakota Place Unit Newlands
- 405 Valley View Dr
- 440 Japonica Way
- 815 Alpine Ave Unit 2
- 656 Juniper Ave
- 1023 Forest Ave
- 864 Iris Ave
- 706 Juniper Ave
Your Personal Tour Guide
Ask me questions while you tour the home.