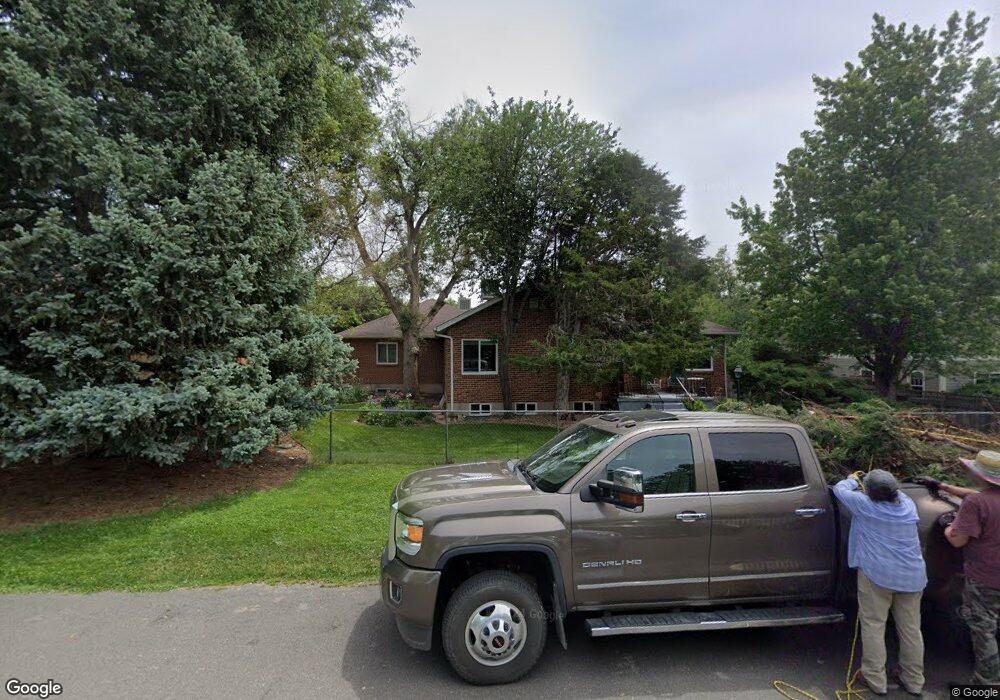
3076 11th St Boulder, CO 80304
Newlands NeighborhoodEstimated Value: $2,021,833 - $3,192,000
8
Beds
4
Baths
2,498
Sq Ft
$1,008/Sq Ft
Est. Value
About This Home
This home is located at 3076 11th St, Boulder, CO 80304 and is currently estimated at $2,518,708, approximately $1,008 per square foot. 3076 11th St is a home located in Boulder County with nearby schools including Foothill Elementary School, Casey Middle School, and Boulder High School.
Ownership History
Date
Name
Owned For
Owner Type
Purchase Details
Closed on
May 23, 2022
Sold by
Trevarton Margaret A
Bought by
Trevarton Margaret A and Trevarton Darryl
Current Estimated Value
Home Financials for this Owner
Home Financials are based on the most recent Mortgage that was taken out on this home.
Original Mortgage
$425,000
Outstanding Balance
$403,741
Interest Rate
5.25%
Mortgage Type
New Conventional
Estimated Equity
$2,114,967
Purchase Details
Closed on
Aug 31, 2017
Sold by
Trevarton Margaret A and The Philip L Rice Family Trust
Bought by
Trevarton Margaret A
Purchase Details
Closed on
May 6, 1998
Sold by
Rice Philip L and Rice Patricia J
Bought by
Philip L Rice Family Trust
Purchase Details
Closed on
Jun 1, 1996
Sold by
Rice Philip L and Rice Patricia J
Bought by
Rice Philip L
Purchase Details
Closed on
Jul 17, 1964
Bought by
Rice Philip L Family Trust
Create a Home Valuation Report for This Property
The Home Valuation Report is an in-depth analysis detailing your home's value as well as a comparison with similar homes in the area
Home Values in the Area
Average Home Value in this Area
Purchase History
| Date | Buyer | Sale Price | Title Company |
|---|---|---|---|
| Trevarton Margaret A | -- | None Listed On Document | |
| Trevarton Margaret A | -- | None Available | |
| Philip L Rice Family Trust | -- | -- | |
| Rice Philip L | -- | -- | |
| Rice Philip L Family Trust | $247,500 | -- |
Source: Public Records
Mortgage History
| Date | Status | Borrower | Loan Amount |
|---|---|---|---|
| Open | Trevarton Margaret A | $425,000 |
Source: Public Records
Tax History
| Year | Tax Paid | Tax Assessment Tax Assessment Total Assessment is a certain percentage of the fair market value that is determined by local assessors to be the total taxable value of land and additions on the property. | Land | Improvement |
|---|---|---|---|---|
| 2025 | $12,026 | $122,393 | $110,154 | $12,239 |
| 2024 | $12,026 | $122,393 | $110,154 | $12,239 |
| 2023 | $11,817 | $136,841 | $124,164 | $16,361 |
| 2022 | $9,564 | $102,993 | $89,162 | $13,831 |
| 2021 | $9,120 | $105,956 | $91,727 | $14,229 |
| 2020 | $8,270 | $95,010 | $76,005 | $19,005 |
| 2019 | $8,144 | $95,010 | $76,005 | $19,005 |
| 2018 | $7,289 | $84,074 | $65,232 | $18,842 |
| 2017 | $7,061 | $92,949 | $72,118 | $20,831 |
| 2016 | $6,501 | $83,062 | $54,844 | $28,218 |
| 2015 | $6,156 | $65,599 | $28,497 | $37,102 |
| 2014 | $4,846 | $65,599 | $28,497 | $37,102 |
Source: Public Records
Map
Nearby Homes
- 3086 11th St
- 3135 11th St
- 1237 Elder Ave Unit 1
- 1023 Forest Ave
- 3217 Broadway St
- 3056 8th St
- 2917 13th St
- 865 Grape Ave Unit X
- 3315 Broadway St
- 1412 Elder Ave
- 1201 Balsam Ave Unit 206
- 3010 14th St
- 1241 Balsam Ave
- 1267 Balsam Ave
- 3319 Broadway
- 2958 6th St
- 711 Hawthorn Ave
- 1070 Juniper Ave
- 501 Evergreen Ave
- 2965 17th St
- 3062 11th St
- 3054 11th St
- 3075 Broadway St
- 3069 Broadway St
- 3069 Broadway St Unit 1 HSE
- 3093 Broadway St
- 3046 11th St
- 3079 11th St
- 3075 11th St
- 1080 Evergreen Ave
- 3065 11th St
- 1117 Evergreen Ave
- 3108 11th St
- 1175 Evergreen Ave
- 3103 Broadway St
- 3034 11th St
- 3055 11th St
- 3101 11th St
- 3025 Broadway St Unit 40
- 3025 Broadway St Unit 39
Your Personal Tour Guide
Ask me questions while you tour the home.