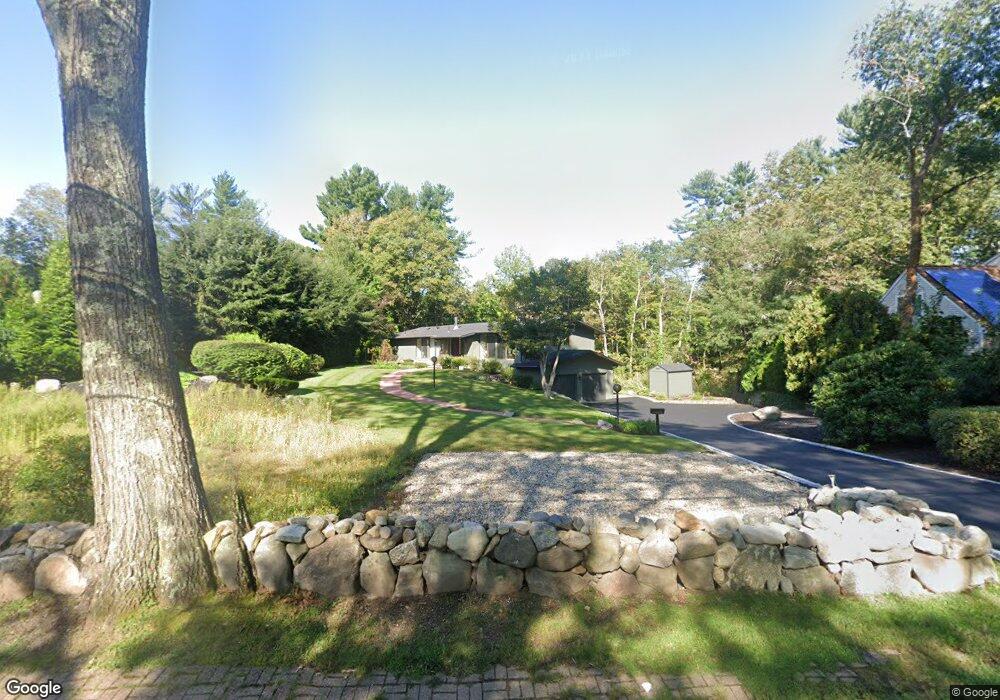
31 Abbot St Andover, MA 01810
Southern Andover NeighborhoodEstimated Value: $1,320,573 - $1,469,000
3
Beds
3
Baths
2,792
Sq Ft
$498/Sq Ft
Est. Value
About This Home
This home is located at 31 Abbot St, Andover, MA 01810 and is currently estimated at $1,390,643, approximately $498 per square foot. 31 Abbot St is a home located in Essex County with nearby schools including Bancroft Elementary School, Doherty Middle School, and Andover High School.
Ownership History
Date
Name
Owned For
Owner Type
Purchase Details
Closed on
Aug 29, 2025
Sold by
31 Abbot Street Nt and Rafiee
Bought by
Cook Michael R and Cook Ashley C
Current Estimated Value
Home Financials for this Owner
Home Financials are based on the most recent Mortgage that was taken out on this home.
Original Mortgage
$875,000
Outstanding Balance
$871,961
Interest Rate
6.75%
Mortgage Type
New Conventional
Estimated Equity
$518,682
Purchase Details
Closed on
Oct 21, 2021
Sold by
Rafiee Nasser and Rafiee Kathleen
Bought by
31 Abbot Street Nt and Rafiee
Purchase Details
Closed on
Jul 17, 2013
Sold by
Short Ft and Short
Bought by
Rafiee Nasser and Rafiee Kathleen
Purchase Details
Closed on
Dec 6, 1996
Sold by
Venkataraman V
Bought by
Short Stanley
Purchase Details
Closed on
Apr 2, 1992
Sold by
Stapfer Adrian P
Bought by
Venkataraman V
Home Financials for this Owner
Home Financials are based on the most recent Mortgage that was taken out on this home.
Original Mortgage
$260,000
Interest Rate
8.73%
Mortgage Type
Purchase Money Mortgage
Create a Home Valuation Report for This Property
The Home Valuation Report is an in-depth analysis detailing your home's value as well as a comparison with similar homes in the area
Home Values in the Area
Average Home Value in this Area
Purchase History
| Date | Buyer | Sale Price | Title Company |
|---|---|---|---|
| Cook Michael R | $1,350,000 | -- | |
| Cook Michael R | $1,350,000 | -- | |
| 31 Abbot Street Nt | -- | None Available | |
| 31 Abbot Street Nt | -- | None Available | |
| 31 Abbot Street Nt | -- | None Available | |
| Rafiee Nasser | $717,500 | -- | |
| Rafiee Nasser | $717,500 | -- | |
| Rafiee Nasser | $717,500 | -- | |
| Short Stanley | $373,000 | -- | |
| Short Stanley | $373,000 | -- | |
| Venkataraman V | $341,720 | -- | |
| Venkataraman V | $341,720 | -- |
Source: Public Records
Mortgage History
| Date | Status | Borrower | Loan Amount |
|---|---|---|---|
| Open | Cook Michael R | $875,000 | |
| Closed | Cook Michael R | $875,000 | |
| Previous Owner | Venkataraman V | $260,000 |
Source: Public Records
Tax History
| Year | Tax Paid | Tax Assessment Tax Assessment Total Assessment is a certain percentage of the fair market value that is determined by local assessors to be the total taxable value of land and additions on the property. | Land | Improvement |
|---|---|---|---|---|
| 2024 | $14,945 | $1,160,300 | $785,500 | $374,800 |
| 2023 | $14,456 | $1,058,300 | $707,500 | $350,800 |
| 2022 | $13,474 | $922,900 | $626,100 | $296,800 |
| 2021 | $12,903 | $843,900 | $569,300 | $274,600 |
| 2020 | $12,395 | $825,800 | $555,500 | $270,300 |
| 2019 | $12,285 | $804,500 | $539,200 | $265,300 |
| 2018 | $11,800 | $754,500 | $508,700 | $245,800 |
| 2017 | $11,292 | $743,900 | $498,700 | $245,200 |
| 2016 | $11,053 | $745,800 | $498,700 | $247,100 |
| 2015 | $10,684 | $713,700 | $479,400 | $234,300 |
Source: Public Records
Map
Nearby Homes
- 3 Torr St
- 105 Central St
- 154 Main St
- 100.5 Main St Unit Q
- 96 N Main St Unit 3
- 33 Chestnut St Unit 2
- 46 Whittier St
- 11 Cuba St
- 81 Chestnut St Unit 81
- 36 High St
- 31 Porter Rd
- 1 Sweeney Ct
- 16 Porter Rd
- 4 Hammond Way
- 49 Salem St
- 52 Salem St
- 1 Delisio Dr
- 57 Salem St
- 1 Stratford Rd
- 2 Powder Mill Square Unit 2B
Your Personal Tour Guide
Ask me questions while you tour the home.