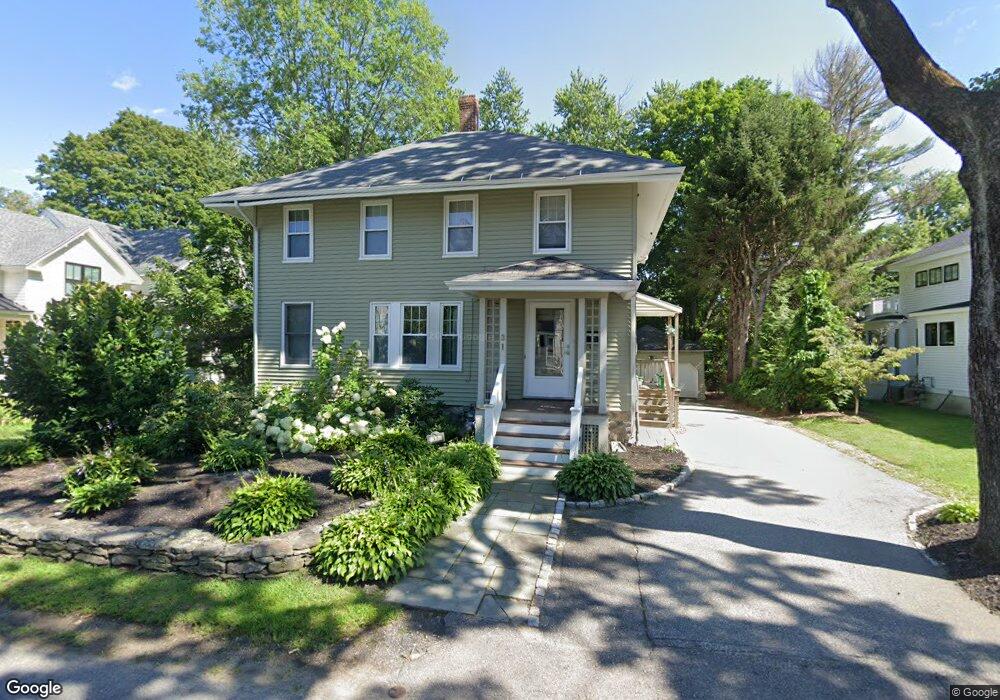
31 Fielding St Concord, MA 01742
Estimated Value: $1,801,000 - $2,051,000
5
Beds
3
Baths
2,912
Sq Ft
$658/Sq Ft
Est. Value
About This Home
This home is located at 31 Fielding St, Concord, MA 01742 and is currently estimated at $1,915,006, approximately $657 per square foot. 31 Fielding St is a home located in Middlesex County with nearby schools including Alcott Elementary School, Concord Middle School, and Concord Carlisle High School.
Ownership History
Date
Name
Owned For
Owner Type
Purchase Details
Closed on
Nov 20, 2024
Sold by
Tilles Dan S and Baca Sandra J
Bought by
Dan Tilles Ret and Tilles
Current Estimated Value
Purchase Details
Closed on
Nov 19, 2020
Sold by
Tilles Dan S
Bought by
Tilles Dan S and Baca Sandra J
Purchase Details
Closed on
Sep 6, 2012
Sold by
Tilles Dan S
Bought by
Tilles Dan S and Baca Sandra J
Purchase Details
Closed on
Jul 1, 2003
Sold by
Tilles Dorcas W
Bought by
Tilles Dan S
Home Financials for this Owner
Home Financials are based on the most recent Mortgage that was taken out on this home.
Original Mortgage
$215,000
Interest Rate
5.53%
Purchase Details
Closed on
Jun 23, 1989
Sold by
Barzun Roger M
Bought by
Tilles Dan S
Create a Home Valuation Report for This Property
The Home Valuation Report is an in-depth analysis detailing your home's value as well as a comparison with similar homes in the area
Home Values in the Area
Average Home Value in this Area
Purchase History
We collect this data history from publicly available records. To have your information removed, we recommend requesting removal directly through your county’s website.
| Date | Buyer | Sale Price | Title Company |
|---|---|---|---|
| Dan Tilles Ret | -- | None Available | |
| Dan Tilles Ret | -- | None Available | |
| Tilles Dan S | -- | None Available | |
| Tilles Dan S | -- | None Available | |
| Tilles Dan S | -- | -- | |
| Tilles Dan S | -- | -- | |
| Tilles Dan S | -- | -- | |
| Tilles Dan S | -- | -- | |
| Tilles Dan S | $265,000 | -- |
Source: Public Records
Mortgage History
We collect this data history from publicly available records. To have your information removed, we recommend requesting removal directly through your county’s website.
| Date | Status | Borrower | Loan Amount |
|---|---|---|---|
| Previous Owner | Tilles Dan S | $215,000 | |
| Previous Owner | Tilles Dan S | $227,150 |
Source: Public Records
Tax History
| Year | Tax Paid | Tax Assessment Tax Assessment Total Assessment is a certain percentage of the fair market value that is determined by local assessors to be the total taxable value of land and additions on the property. | Land | Improvement |
|---|---|---|---|---|
| 2025 | $216 | $1,629,900 | $833,800 | $796,100 |
| 2024 | $21,007 | $1,599,900 | $833,800 | $766,100 |
| 2023 | $17,018 | $1,313,100 | $682,200 | $630,900 |
| 2022 | $18,254 | $1,236,700 | $545,700 | $691,000 |
| 2021 | $17,075 | $1,160,000 | $545,700 | $614,300 |
| 2020 | $16,648 | $1,169,900 | $545,700 | $624,200 |
| 2019 | $16,178 | $1,140,100 | $569,100 | $571,000 |
| 2018 | $14,526 | $1,016,500 | $504,600 | $511,900 |
| 2017 | $13,983 | $993,800 | $462,800 | $531,000 |
| 2016 | $13,509 | $970,500 | $462,800 | $507,700 |
| 2015 | $12,665 | $886,300 | $428,500 | $457,800 |
Source: Public Records
Map
Nearby Homes
- 24 Fielding St
- 180 Laurel St
- 150 Hubbard St Unit B
- 353 Thoreau St
- 95 Hubbard St
- 46 Sudbury Rd
- 33 Everett St
- 32 Thoreau St Unit 32
- 70 Lexington Rd
- 105 Lexington Rd
- 61B Walden St
- 152 Partridge Ln
- 25 Fairhaven Rd
- 59 Martin Rd
- 29 Willard Common
- 51 Revolutionary Rd
- 343 Nashawtuc Rd
- 38 Ripley Hill Rd
- 93 Nashoba Rd
- 330 Lowell Rd
- 37 Fielding St
- 23 Fielding St
- 43 Fielding St
- 28 Fielding St
- 15 Fielding St
- 34 Fielding St
- 256 Thoreau St
- 18 Fielding St
- 266 Thoreau St
- 248 Thoreau St
- 31 Willow St
- 25 Willow St
- 40 Union St Unit 42
- 17 Willow St
- 234 Thoreau St
- 274 Thoreau St
- 30 Union St
- 11-13 Willow St
- 11 Willow St Unit 13
- 13 Willow St
Your Personal Tour Guide
Ask me questions while you tour the home.