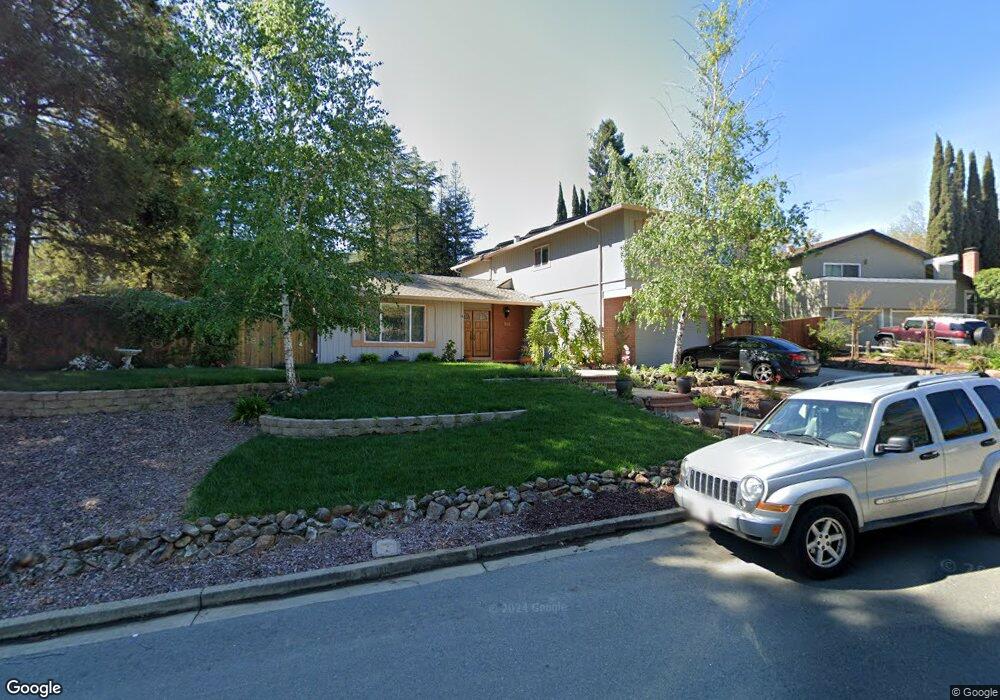
31 Mt Tamalpais Ct Clayton, CA 94517
Estimated Value: $1,047,000 - $1,244,000
4
Beds
3
Baths
2,141
Sq Ft
$524/Sq Ft
Est. Value
About This Home
This home is located at 31 Mt Tamalpais Ct, Clayton, CA 94517 and is currently estimated at $1,121,227, approximately $523 per square foot. 31 Mt Tamalpais Ct is a home located in Contra Costa County with nearby schools including Mt. Diablo Elementary School, Diablo View Middle School, and College Park High School.
Ownership History
Date
Name
Owned For
Owner Type
Purchase Details
Closed on
Jul 17, 1998
Sold by
Johnston Ross A and Johnston Emily R
Bought by
Muela John and Muela Dawn
Current Estimated Value
Home Financials for this Owner
Home Financials are based on the most recent Mortgage that was taken out on this home.
Original Mortgage
$231,960
Outstanding Balance
$47,057
Interest Rate
6.9%
Mortgage Type
Stand Alone First
Estimated Equity
$1,074,170
Create a Home Valuation Report for This Property
The Home Valuation Report is an in-depth analysis detailing your home's value as well as a comparison with similar homes in the area
Home Values in the Area
Average Home Value in this Area
Purchase History
| Date | Buyer | Sale Price | Title Company |
|---|---|---|---|
| Muela John | $290,000 | Fidelity National Title Co |
Source: Public Records
Mortgage History
| Date | Status | Borrower | Loan Amount |
|---|---|---|---|
| Open | Muela John | $231,960 | |
| Closed | Muela John | $28,995 |
Source: Public Records
Tax History Compared to Growth
Tax History
| Year | Tax Paid | Tax Assessment Tax Assessment Total Assessment is a certain percentage of the fair market value that is determined by local assessors to be the total taxable value of land and additions on the property. | Land | Improvement |
|---|---|---|---|---|
| 2025 | $6,524 | $491,389 | $164,598 | $326,791 |
| 2024 | $6,391 | $481,755 | $161,371 | $320,384 |
| 2023 | $6,391 | $472,309 | $158,207 | $314,102 |
| 2022 | $6,292 | $463,049 | $155,105 | $307,944 |
| 2021 | $6,130 | $453,970 | $152,064 | $301,906 |
| 2019 | $6,001 | $440,506 | $147,554 | $292,952 |
| 2018 | $5,772 | $431,869 | $144,661 | $287,208 |
| 2017 | $5,577 | $423,402 | $141,825 | $281,577 |
| 2016 | $5,416 | $415,101 | $139,045 | $276,056 |
| 2015 | $5,343 | $408,867 | $136,957 | $271,910 |
| 2014 | $5,241 | $400,859 | $134,275 | $266,584 |
Source: Public Records
Map
Nearby Homes
- 581 Mt Dell Dr
- 20 Clark Creek Cir
- 41 Mt Shasta Place
- 7 Clark Creek Cir
- 23 Mt Wilson Way
- 785 Bloching Cir
- 33 El Molino Dr
- 980 Oak St
- 5900 High St
- 1182 Easley Dr
- 1280 Shell Cir
- 1295 Shell Cir Unit 1
- 1105 Peacock Creek Dr
- 7 Atchinson Stage Rd
- 814 Chert Place
- 50 Nottingham Place
- 1341 Maryland Dr
- 1021 Pebble Beach Dr
- 1152 Via Doble
- 337 Saclan Terrace
- 41 Mt Tamalpais Ct
- 21 Mt Tamalpais Ct
- 506 Mt Dell Dr
- 510 Mt Dell Dr
- 506 Mount Dell Dr
- 40 Mt Tamalpais Ct
- 30 Mt Tamalpais Ct
- 51 Mt Tamalpais Ct
- 502 Mt Dell Dr
- 11 Mt Tamalpais Ct
- 514 Mt Dell Dr
- 50 Mt Tamalpais Ct
- 20 Mt Tamalpais Ct
- 522 Mt Dell Dr
- 31 Mt Teton Place
- 538 Mt Dell Dr
- 518 Mt Dell Dr
- 10 Mt Tamalpais Ct
- 21 Mt Teton Place
- 509 Mt Dell Dr