31 Valencia Ln Redlands, CA 92374
North Redlands NeighborhoodEstimated Value: $769,000 - $906,000
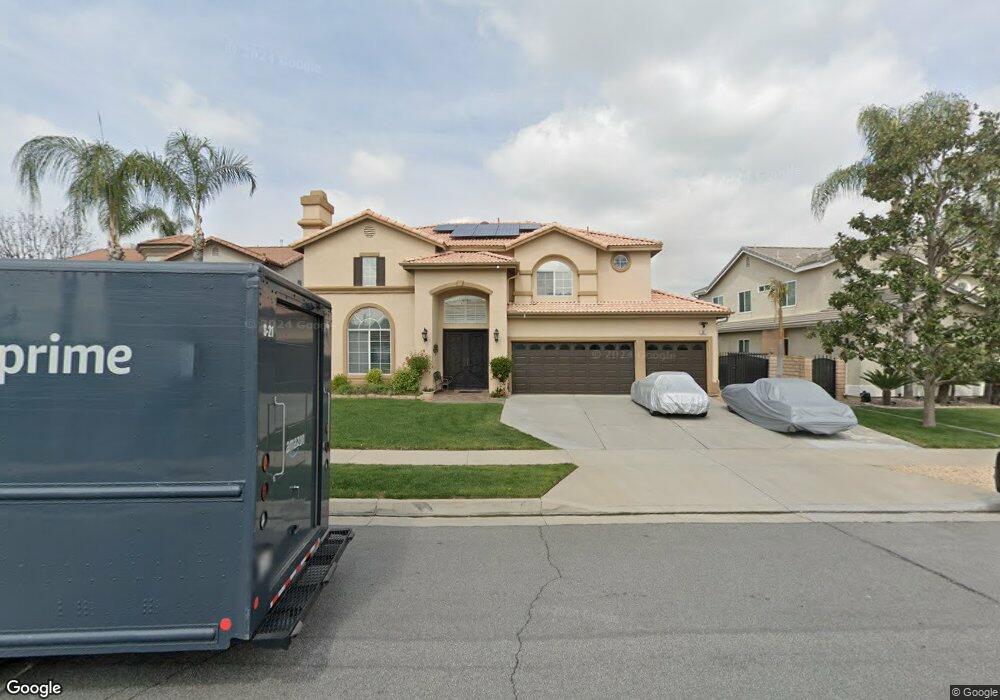
About This Home
This home is located at 31 Valencia Ln, Redlands, CA 92374 and is currently estimated at $815,020, approximately $299 per square foot. 31 Valencia Ln is a home located in San Bernardino County with nearby schools including Crafton Elementary School, Moore Middle School, and Redlands East Valley High School.
Ownership History
We collect this data history from publicly available records. To have your information removed, we recommend requesting removal directly through your county’s website.
Purchase Details
Purchase Details
Home Financials for this Owner
Home Financials are based on the most recent Mortgage that was taken out on this home.Purchase Details
Home Financials for this Owner
Home Financials are based on the most recent Mortgage that was taken out on this home.Home Values in the Area
Average Home Value in this Area
Purchase History
We collect this data history from publicly available records. To have your information removed, we recommend requesting removal directly through your county’s website.
| Date | Buyer | Sale Price | Title Company |
|---|---|---|---|
| -- | None Available | ||
| $375,000 | First American | ||
| $301,500 | Fidelity National Title Ins |
Mortgage History
We collect this data history from publicly available records. To have your information removed, we recommend requesting removal directly through your county’s website.
| Date | Status | Borrower | Loan Amount |
|---|---|---|---|
| Open | $235,000 | ||
| Previous Owner | $241,200 |
Tax History
We collect this data history from publicly available records. To have your information removed, we recommend requesting removal directly through your county’s website.
| Year | Tax Paid | Tax Assessment Tax Assessment Total Assessment is a certain percentage of the fair market value that is determined by local assessors to be the total taxable value of land and additions on the property. | Land | Improvement |
|---|---|---|---|---|
| 2025 | $6,820 | $554,501 | $142,180 | $412,321 |
| 2024 | $6,367 | $543,628 | $139,392 | $404,236 |
| 2023 | $6,358 | $532,969 | $136,659 | $396,310 |
| 2022 | $6,264 | $522,518 | $133,979 | $388,539 |
| 2021 | $6,377 | $512,273 | $131,352 | $380,921 |
| 2020 | $6,281 | $507,020 | $130,005 | $377,015 |
| 2019 | $6,104 | $497,079 | $127,456 | $369,623 |
| 2018 | $5,950 | $487,332 | $124,957 | $362,375 |
| 2017 | $5,898 | $477,777 | $122,507 | $355,270 |
| 2016 | $5,713 | $459,000 | $138,200 | $320,800 |
| 2015 | $5,329 | $425,000 | $128,000 | $297,000 |
| 2014 | $5,146 | $410,000 | $123,000 | $287,000 |
Map
- 313 Van Ness Ln
- 325 Van Ness Ln
- 0 Wabash Ave Unit IV26099413
- 1621 Arcata Dr
- 123 S La Salle St
- 1592 Christopher Ln
- 1575 Christopher Ln
- 1562 E Citrus Ave
- 1571 Christopher Ln
- 4 Dearborn Cir
- 210 Jesse Way
- 626 N Dearborn St Unit 7
- 626 N Dearborn St Unit 17
- 626 N Dearborn St Unit 205
- 626 N Dearborn St Unit 61
- 0 E Colton Ave
- 10696 Opal Ave
- 608 Falcon Ln
- 1721 E Colton Ave
- 1721 E Colton Ave Unit 69
- 27 Valencia Ln
- 23 Valencia Ln
- 133 Rainbow Ln
- 127 Rainbow Ln
- 35 Valencia Ln
- 19 Valencia Ln
- 30 Valencia Ln
- 15 Valencia Ln
- 72 N La Salle St
- 139 Rainbow Ln
- 52 N La Salle St
- 39 Valencia Ln
- 32 N La Salle St
- 34 Valencia Ln
- 121 Rainbow Ln
- 100 N La Salle St
- 10 N La Salle St
- 38 Valencia Ln
- 128 Rainbow Ln
- 145 Rainbow Ln
Ask me questions while you tour the home.