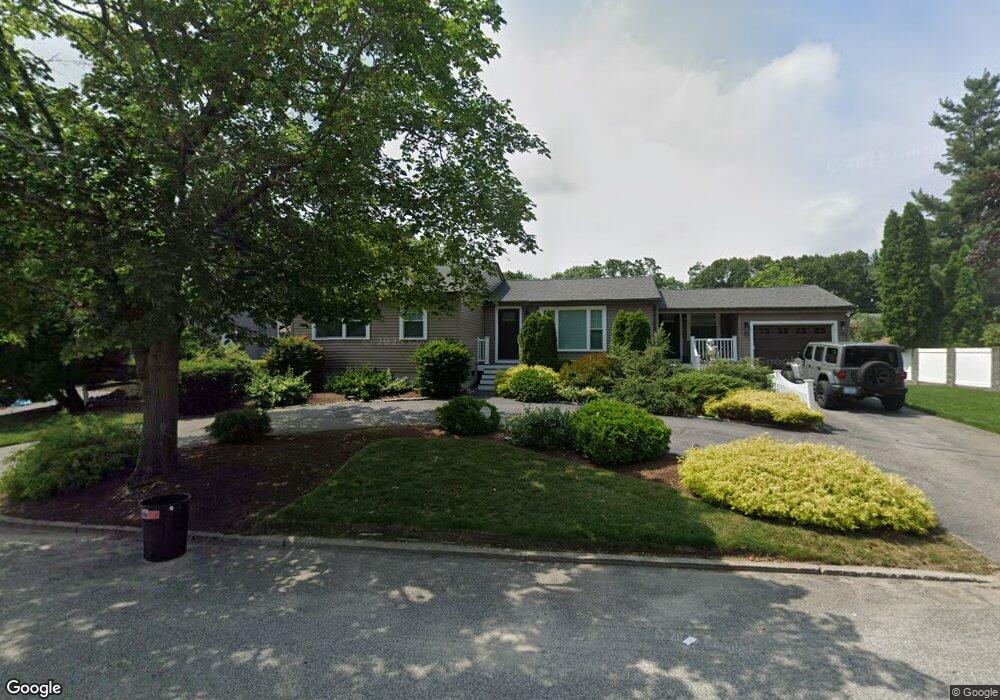
31 Zinnia Dr Cranston, RI 02920
Garden City NeighborhoodEstimated Value: $485,000 - $574,000
3
Beds
3
Baths
1,588
Sq Ft
$328/Sq Ft
Est. Value
About This Home
This home is located at 31 Zinnia Dr, Cranston, RI 02920 and is currently estimated at $520,572, approximately $327 per square foot. 31 Zinnia Dr is a home located in Providence County with nearby schools including Garden City School, Western Hills Middle School, and Cranston High School West.
Ownership History
Date
Name
Owned For
Owner Type
Purchase Details
Closed on
Aug 17, 2020
Sold by
Marocco Steven E and Marocco-Quirk Denise M
Bought by
Marocco Emilio J and Marocco Evelyn
Current Estimated Value
Home Financials for this Owner
Home Financials are based on the most recent Mortgage that was taken out on this home.
Original Mortgage
$22,666
Outstanding Balance
$20,061
Interest Rate
3%
Mortgage Type
Purchase Money Mortgage
Estimated Equity
$500,511
Purchase Details
Closed on
Aug 14, 2020
Sold by
Marocco Emilio J and Marocco Evelyn
Bought by
Butler Patrick K
Home Financials for this Owner
Home Financials are based on the most recent Mortgage that was taken out on this home.
Original Mortgage
$22,666
Outstanding Balance
$20,061
Interest Rate
3%
Mortgage Type
Purchase Money Mortgage
Estimated Equity
$500,511
Create a Home Valuation Report for This Property
The Home Valuation Report is an in-depth analysis detailing your home's value as well as a comparison with similar homes in the area
Home Values in the Area
Average Home Value in this Area
Purchase History
| Date | Buyer | Sale Price | Title Company |
|---|---|---|---|
| Marocco Emilio J | -- | None Available | |
| Butler Patrick K | $280,000 | None Available |
Source: Public Records
Mortgage History
| Date | Status | Borrower | Loan Amount |
|---|---|---|---|
| Open | Butler Patrick K | $22,666 |
Source: Public Records
Tax History Compared to Growth
Tax History
| Year | Tax Paid | Tax Assessment Tax Assessment Total Assessment is a certain percentage of the fair market value that is determined by local assessors to be the total taxable value of land and additions on the property. | Land | Improvement |
|---|---|---|---|---|
| 2025 | $5,471 | $394,200 | $113,000 | $281,200 |
| 2024 | $5,365 | $394,200 | $113,000 | $281,200 |
| 2023 | $5,241 | $277,300 | $78,000 | $199,300 |
| 2022 | $5,133 | $277,300 | $78,000 | $199,300 |
| 2021 | $4,991 | $277,300 | $78,000 | $199,300 |
| 2020 | $4,891 | $235,500 | $81,700 | $153,800 |
| 2019 | $4,891 | $235,500 | $81,700 | $153,800 |
| 2018 | $4,778 | $235,500 | $81,700 | $153,800 |
| 2017 | $4,733 | $206,300 | $74,300 | $132,000 |
| 2016 | $4,631 | $206,300 | $74,300 | $132,000 |
| 2015 | $4,631 | $206,300 | $74,300 | $132,000 |
| 2014 | $3,626 | $190,100 | $74,300 | $115,800 |
Source: Public Records
Map
Nearby Homes
- 1097 Pontiac Ave
- 99 Harvard St
- 31 Celestia Ave
- 189 Poplar Dr
- 34 Keller Ave
- 105 Fordson Ave
- 113 Fordson Ave
- 200 Hoffman Ave Unit 505
- 28 Hybrid Dr
- 132 Fordson Ave Unit 12
- 143 Hoffman Ave Unit 109
- 143 Hoffman Ave Unit 206
- 132 Hoffman Ave Unit 207
- 132 Hoffman Ave Unit 110
- 26 Keith Ave
- 150 Riverside Ave
- 51 E Bel Air Rd
- 35 Manson Ave
- 45 Hamden Rd
- 75 Dale Ave